Operations | Monitoring | ITSM | DevOps | Cloud


Monitoring
The latest News and Information on Monitoring for Websites, Applications, APIs, Infrastructure, and other technologies.
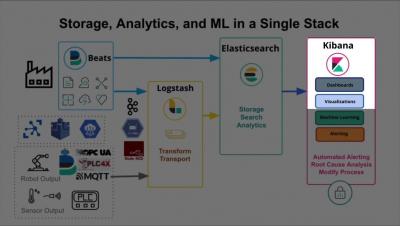
RCA Series: Root Cause Analysis in Manufacturing, Electric Grids & Connected Devices (4/4)

Scale Your Monitoring and Observability With Sensu
Sensu is the complete cloud monitoring solution for observability at scale, designed to give you rich insight and ensure that you know what’s going on everywhere in your system. With true multi-tenancy, an enterprise datastore that keeps pace as you scale, and streaming handlers to process all those events, you can rely on Sensu for cloud, container, and application performance monitoring that provides deep visibility into your entire infrastructure.

The state of ITOM in 2023: Strategic insights into observability, AIOps, cloud migration, and more
As the IT operations environment grows increasingly intricate, businesses are starting to recognize the significance of a flawless customer experience. Customer expectations are getting higher by the day, to the point where organizations cannot afford even a few minutes of downtime or service degradation. To prevent this, they need to avoid outdated methods of operations and prevent downtime-causing issues proactively.

Avantra SAP security FAQ
We understand the importance of security when it comes to your SAP system(s) within your organization. As cyber attacks continue to become more successful, it is essential to have a process in place. Below are several frequently asked questions regarding security to provide some insight on our approach and how Avantra can help you navigate through this journey.

Running Postgres in Docker
So you want to spin up a Postgres database on your local machine, but you don't fancy having to install and manage everything manually? Running Postgres inside Docker is a great way to simplify the situation. It lets you: In this article I will explain how to do this step by step.

Gain real user monitoring insights with Grafana Cloud Frontend Observability
At ObserabilityCON 2022, we announced a limited private preview program for Grafana Cloud Frontend Observability, our hosted service for real user monitoring. Today we are excited to introduce a public preview program that makes Frontend Observability accessible to all Grafana Cloud users, including those in our generous free-forever tier. Simply look for Frontend under Apps in the left-hand navigation of the Grafana Cloud UI and click through to set up the feature. (Not a Grafana Cloud user?

Grafana Tempo 2.1 release: TraceQL performance improvements
Grafana Tempo 2.1 is out and comes with a host of TraceQL improvements. Tempo 2.1 comes with some nice incremental improvements to TraceQL and likely some breaking changes. There’s a section down below about those, too.

Empowering Security Teams: The Importance of Data Control and Freedom of Choice
Enterprises are getting increasingly tired of feeling locked into vendors, and rightfully so. As soon as you put your observability data into a SaaS vendors’ storage, it’s now their data, and it’s difficult to get it out or reuse it for other purposes. As a result, strategic independence is becoming increasingly important as organizations decide what data management tools they’re going to invest time and resources into.

Simplifying agent management for AppDynamics SaaS and On-Premises
A new set of capabilities in Cisco AppDynamics SaaS and On-Premises deployments enables users to spend less time maintaining software for application performance monitoring. Agent management has historically been time-consuming, labor-intensive and required a high level of application experience.