Operations | Monitoring | ITSM | DevOps | Cloud

Monitoring

The latest News and Information on Monitoring for Websites, Applications, APIs, Infrastructure, and other technologies.

5 Signs You Have Outgrown Your Mobile Monitoring Solution

Imagine you start a new hobby — let’s say bike riding. You don’t want to invest a lot in a bike because you’re not sure that you’ll like it. Luckily, you snag a free bike from a friend — it’s clunky, but the price is right. You start out with short rides around your neighborhood and eventually find yourself riding every day, going on longer and longer rides. Your free, heavy bike is holding you back.

Incident Management Steps and Best Practices

According to the Uptime Institute’s 2022 Outage Analysis report, one out of every five companies has experienced a “serious” or “severe” incident over the past three years—a percentage that’s increasing. Those incidents are expensive: over 60% cost more than $100,000, while 15% set their companies back close to $1 million.

Using the Graphite API for Beginners

Application Programming Interface, or API, is an important element to consider when you design an online product or platform. Well-designed API is equivalent to a well-designed user interface for enterprise customers. When you implement an intuitive and easy-to-use interface, your product can retain and attract more users.

Digital Experience Monitoring: What it is and Why it Matters

The art of monitoring the influence of an application’s performance on business outcomes is constantly evolving. It used to be directing IT teams to act on insights from an Application Performance Monitoring (APM) solution was enough to drive business outcomes. Now we know the user experience has a heavy hand in determining whether a digital platform survives or dies. An APM solution keeps tabs on the performance of application components such as servers, databases, and services.

How to Instrument a Legacy Mule App with OpenTelemetry

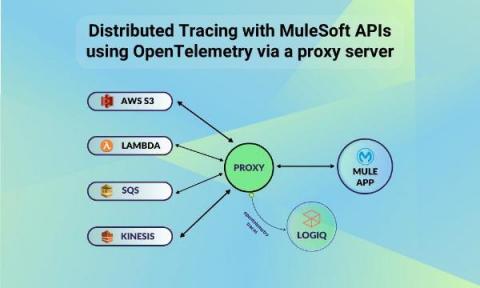
In the previous article, we talked about Distributed Tracing with MuleSoft APIs using OpenTelemetry. In this post, we’ll go through the process of integrating Distributed Tracing with MuleSoft APIs using OpenTelemetry via a proxy server. The purpose of this article is to demonstrate how we can instrument a legacy mule app with open telemetry without making changes to the existing app. Here, we’re showing an example of getting data from a header as well as a query parameter.

Dashboard Fridays: Steam Player Data

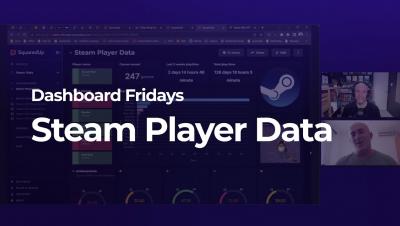
This is a fun dashboard to capture some Steam player statistics using the WebAPI plugin. Created by SquaredUp's Director of Engineering, Josip Dlaka, this handy dashboard displays how long his kids have been online, how many friends they have, and what they have achieved without even leaving their room! SquaredUp allows you to combine and visualize data from multiple data sources in a meaningful way, so this aesthetically pleasing dashboard gives a good overview of key Steam player metrics in Josip's household.

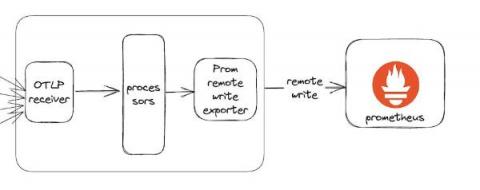
A practical guide to data collection with OpenTelemetry and Prometheus

Grafana Labs has always been actively involved in the OpenTelemetry community, even working with the predecessor projects OpenTracing and OpenCensus. We have been supporting OTLP as the primary input protocol for our distributed tracing project, Grafana Tempo, since its inception, and our Grafana Agent embeds parts of the OpenTelemetry Collector.

5 Tips for Faster Troubleshooting to Reduce MTTR

In today’s rapidly evolving digital landscape, organizations heavily rely on their applications and systems to deliver optimal performance. As such, driving down the key metric of Mean Time to Resolution (MTTR) is clearly one of the biggest challenges facing observability practitioners today.