Operations | Monitoring | ITSM | DevOps | Cloud

Monitoring

The latest News and Information on Monitoring for Websites, Applications, APIs, Infrastructure, and other technologies.

Maximize Profitability: Unleash the Power of FinOps for MSPs

It’s never been a better time to be a Managed Service Provider (MSP). Why? Small and medium businesses (SMBs) use cloud-based services for their operations. Eighty-eight percent say they currently use an MSP or are considering one. But many obstacles remain even if SMBs are in high demand for MSPs. They need to keep their profits and revenue growing, focusing on cloud unit economics, customer pricing strategies, and efficient operations.

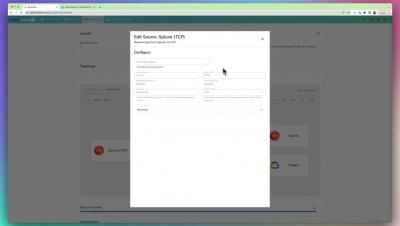
How to use Splunk Universal Forwarders With BindPlane OP

A tutorial on how to start collecting data from your splunk universal forwarders using BindPlane as an aggregator, giving you the ability to start sending telemetry data to multiple destinations. About ObservIQ: observIQ brings clarity and control to our customer's existing observability chaos. How? Through an observability pipeline: a fast, powerful and intuitive orchestration engine built for the modern observability team. Our product is designed to help teams significantly reduce cost, simplify collection, and standardize their observability data.
Sponsored Post

Kubernetes Monitoring Best Practices

Kubernetes can be installed using different tools, whether open-source, third-party vendor, or in a public cloud. In most cases, default installations have limited monitoring capabilities. Therefore, once a Kubernetes cluster is running, administrators must implement monitoring solutions to meet their requirements. Typical use cases for Kubernetes monitoring include: Effective Kubernetes monitoring requires a mix of tools, strategy, and technical expertise. To help you get it right, this article will explore seven essential Kubernetes monitoring best practices in detail.

Top PostgreSQL Monitoring Tools in 2023

Armed with the right PostgreSQL monitoring tools, database administrators and developers can identify potential bottlenecks, troubleshoot problems and make informed decisions to optimize their database environments. Monitoring PostgreSQL databases provides invaluable insight into their performance, health and overall efficiency.

Your First 100 Days With Cribl: Why Having an Onboarding Process Matters

The process of adding new data to operations and security analytics tools is familiar to admins. New data onboarding can be a tiresome process that takes up too much time and delays getting value from the new data. The process typically begins with the admin engaging the data source owner, getting the wrong data sample, and then having to try again.

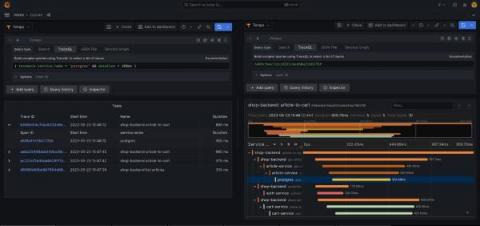
Simplify managing Grafana Tempo instances in Kubernetes with the Tempo Operator

I’ve been working with Grafana Tempo for about half a year now, and one thing I like about it is that Tempo requires only object storage for storing traces, which is easy to set up in both cloud environments and on-premises. Another outstanding feature is TraceQL, which allows searching for relevant traces with a powerful query language.

Dashboard Fridays: Public Releases

Build using the Jira and Pendo plugins, this SquaredUp dashboard provides a sense of how popular our latest Dashboard Server release is with customers, and whether any bugs have been raised against it. We can now get a quick overview of any issues in the latest release that are affecting our customers. Plus, through the level of uptake of the new release, we can see if we have achieved the level of quality that we were aiming for.