Operations | Monitoring | ITSM | DevOps | Cloud

Monitoring

The latest News and Information on Monitoring for Websites, Applications, APIs, Infrastructure, and other technologies.

The Invisible Threat: Understanding Domain Hijacking and Its Consequences

Did you notice when we announced the new domain expiration monitoring feature? Read on to see how it might come in handy to you. Domain names are the equivalent of real estate. But the right domain name can also be a money powerhouse. You probably paid as little as $20 for your domain name, but the biggest names out there cost a lot more than that. Trailing behind are: Shocking, isn’t it?

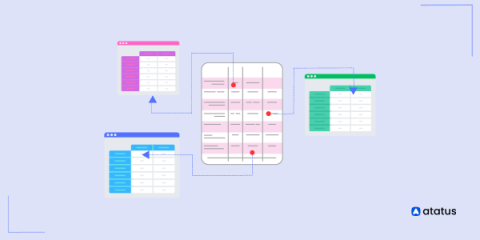
Relational Databases: Exploring Indexes and Transactions

Indexes serve as the key to unlocking the immense potential of relational databases, enabling swift and optimized data access. They act as a roadmap, allowing the database engine to locate specific data quickly, ultimately enhancing query performance. Understanding the nuances of indexes and employing the appropriate indexing techniques can significantly impact the efficiency of a database system.

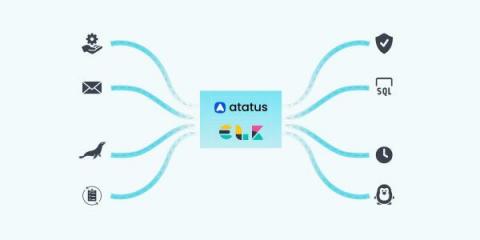
14 Critical Log Files You Need to Monitor for System Security

In the realm of Linux system administration, monitoring log files is essential for maintaining a healthy and secure environment. Linux distributions generate a multitude of log files that capture crucial information about system events, errors, and user activities. These log files act as a silent witness, providing valuable insights into the inner workings of a Linux system.

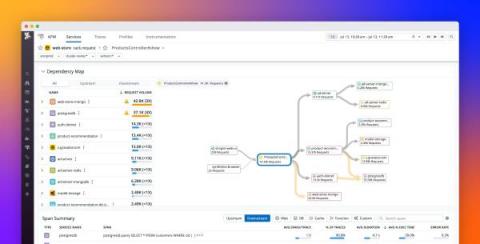
Pinpoint performance issues in downstream services with the Dependency Map Navigator

Visibility into the upstream and downstream dependencies of your services is key to maintaining a performant microservices environment. Application developers and SREs rely on this visibility to quickly trace issues back to the source, which is essential during incidents—when time is of the essence—throughout day-to-day operations, and as systems evolve and scale.

Mastering SVC with Splunk App for Chargeback: App Walkthrough (Part 1)

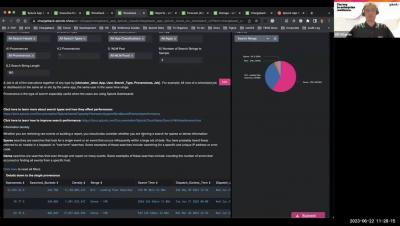
Part 1 of a series of 3 videos outlining how you can use Splunk App for Chargeback to successfully adopt Splunk’s Workload Pricing. These videos will help you get quick insights and proactively monitor key metrics using the Chargeback app’s out-of-the-box capabilities, and then tie usage to business hierarchy to enable chargeback. It will ultimately help you get back in control of how your teams use Splunk by showing you how to identify and manage wasteful workloads.

Lower Your AWS Lambda Bill by Increasing Memory Size- yep!

Lambda allows you to allocate memory for your functions in increments of 1 MB, ranging from a minimum of 128 MB to a maximum of 10,240 MB (10 GB). When we specify the memory size for a Lambda function, AWS will allocate CPU proportionally. For example, a 256 MB function will receive twice the processing power of a 128 MB function.

OpenTelemetry vs Prometheus

OpenTelemetry and Prometheus are both powerful observability tools, each with its own strengths. OpenTelemetry provides a standardized way to collect, instrument, and export telemetry data, while Prometheus excels at time-series monitoring and alerting. In this blog post, we will delve into the similarities and differences between OpenTelemetry and Prometheus, exploring the benefits and advantages of each.

Mastering SVC with Splunk App for Chargeback: Platform Optimization (Part 3)

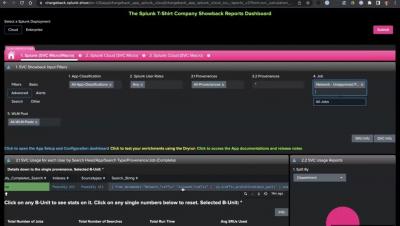
Part 3 of a series of 3 videos outlining how you can use Splunk App for Chargeback to successfully adopt Splunk’s Workload Pricing. These videos will help you get quick insights and proactively monitor key metrics using the Chargeback app’s out-of-the-box capabilities, and then tie usage to business hierarchy to enable chargeback. It will ultimately help you get back in control of how your teams use Splunk by showing you how to identify and manage wasteful workloads.

Transforming Your Telemetry Has Never Been Easier

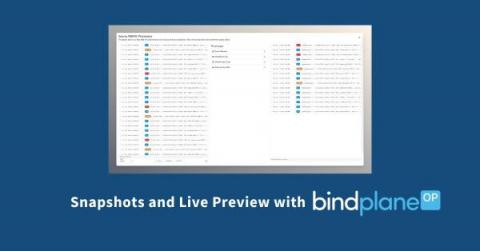
As the foundation of your observability stack, BindPlane OP provides great visibility into your telemetry data, all the way from collection to its final destination. With the introduction of Live Preview in BPOP Enterprise, and a brand new processor workflow, we’ve now made this even better.