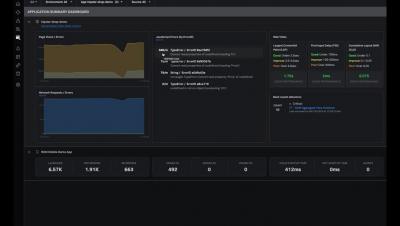
Operations | Monitoring | ITSM | DevOps | Cloud

How to Optimize Your WordPress Site With Pingdom Real User Monitoring

To keep their applications and websites available and accessible, today’s businesses put a lot of emphasis on infrastructure monitoring to ensure their servers are healthy and running. Amid the hustle, many companies overlook the need to monitor a different aspect of their application: user experience.

Why Uptime.com Chose Apdex as a Performance Monitoring Standard

Early Twitter was an adventure. Every day was an open question: would you be able to log in or did the next big story crash the platform? It was taking off and crashing and flying and crashing again. All in real time. It was an exciting time for the internet, and while everything has changed since then it got us thinking: why did we used to tolerate stuff just not working? And why do we still tolerate stuff not working?

How to Optimize Your WordPress Site With Pingdom Real User Monitoring

To keep their applications and websites available and accessible, today’s businesses put a lot of emphasis on infrastructure monitoring to ensure their servers are healthy and running. Amid the hustle, many companies overlook the need to monitor a different aspect of their application: user experience.

Use Real User Monitoring to Optimize Real User Experience on Websites and Applications

What if I told you one of the most common mistakes businesses make is reporting on website performance without understanding user experience? What if I said there was much more to website performance monitoring than simply alerting you when your site is experiencing a downtime outage? No two websites – or baselines – are exactly the same.

Uptime.com Real User Monitoring Report

Take an in-depth tour of the Uptime.com RUM report. Skip to each aspect of reporting with the timestamps below: Comprehensively understand your users – and your baselines. Organize RUM data by URL(s) or group URL(s) to track subdomains; segment data by devices, operating systems, browsers, countries, other geographies – to compare metrics within specific time windows to your website or application’s performance monitoring baselines.

Optimizing Mobile App Startup with Splunk Real User Monitoring

One of the most challenging and rewarding things I do as a Principal Software Engineer in our Splunk Mobile division is ensuring our customers’ experience meets the quality and standards we promise to keep. My team and I are part of an on-call rotation that is committed to measuring and optimizing key Service Level Indicators (SLIs) using Splunk Real User Monitoring (RUM) and Splunk On-Call (iOS & Android) mobile apps.

Synthetic testing: A definition and how it compares to Real User Monitoring

Performance monitoring is critical for a healthy software application. If you don’t have synthetic testing or real user monitoring in place, opportunities for performance optimizations are slipping through the cracks. With the guidance of a monitoring tool, on the other hand, you could be fixing problems such as slow-loading pages within the hour. The two main types of application monitoring are Real User Monitoring (RUM) and synthetic testing (or synthetic monitoring).

End-User Monitoring: How it Can Impact Your Business

After the global pandemic and lockdowns, most businesses look onward to online solutions for their applications. They want to take their business online by creating mobile or web applications. Companies are looking to monitor every aspect of the application, including deployment, bugs, API failures, etc. But the most important thing is how the application behaves when it goes into the hands of the end-users.