Operations | Monitoring | ITSM | DevOps | Cloud
Troubleshoot faulty frontend deployments with Deployment Tracking in RUM
Many developers and product teams are iterating faster and deploying more frequently to meet user expectations for responsive and optimized apps. These constant deployments—which can number in the dozens or even hundreds per day for larger organizations—are essential for keeping your customer base engaged and delighted. However, they also make it harder to pinpoint the exact deployment that led to a rise in errors, a new error, or a performance regression in your app.
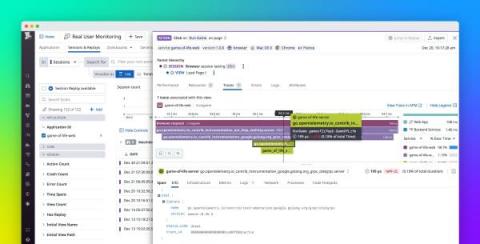
Correlate Datadog RUM events with traces from OTel-instrumented applications
OpenTelemetry (OTel) is an open source, vendor-neutral observability framework that supplies APIs, SDKs, and tools for the instrumentation of cloud-native applications and services. OTel enables you to collect metrics, logs, and traces from a variety of sources and route them to various backends. By itself, however, it can’t help you analyze this data or correlate telemetry from different parts of your stack.
10 Best RUM Tools for Improving Your User Experience
Having user-friendly programs is paramount for any software company’s success. To gain a better understanding of your users’ experience and enjoyment, it’s vital that you learn how customers interact with your app or website. Real user monitoring (RUM) solutions enable your company to visualize how users interact with your software, helping you learn what works best for your customers so you can thrive against the competition.
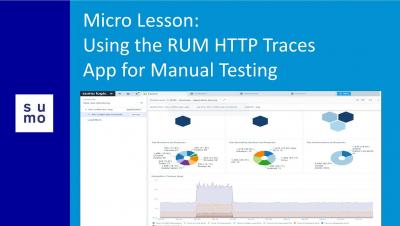
Using the RUM HTTP Traces App for Manual Testing
Combining APM and RUM to Improve Your User Experience
Providing an intuitive user experience that caters to your audience’s needs is essential for your business. By combining APM and RUM, you can help eliminate application issues and give your users a seamless experience. Combining APM and RUM helps you look at both the front-end and back-end of your application, find and fix issues. Don’t quite know what APM and RUM are? Let’s take a closer look.
5 Best Practices for Real User Monitoring
Real User Monitoring (RUM) is a method of web performance monitoring that captures user experience metrics on visitors to your website. It is also known as real user metrics, end-user experience monitoring, or simply user monitoring. You can think of Real User Monitoring as an automated way to get user feedback on your website. Not every user will complete a survey or fill out a feedback form, but RUM listens to each one of your users.
Real User Monitoring (RUM) Is Important for Your Whole Business, Not Just Developers
Real User Monitoring (RUM) is passive website monitoring that has already been used widely for two decades. Large enterprises adopted it first because they had the capital to deploy their own system. But with RUM solutions, like Uptime.com provides, it is affordable for even small businesses. While this is not a new technology, it is new to those businesses that haven’t used it before.
Real User Monitoring (RUM) vs Synthetic Monitoring: What Are the Differences?
Three seconds is a very important number for website owners. They know that 50% of visitors will leave their website if it doesn’t load in that time. Website developers spend a lot of time optimizing and refactoring code so that it runs more quickly and provides a better user experience. User experience is something that monitoring only uptime won’t tell you. A website might be up, but if it takes 10 seconds to load, customers will bounce.
RUM now offers React Native Crash Reporting and Error Tracking
React Native has become the predominant development framework for cross-platform mobile applications. By interacting with native APIs largely under the hood and requiring only a fractional proportion of platform-specific code, it allows you to build applications for iOS, Android, and the browser using the same declarative JavaScript. But this cross-platform adaptability has its downsides.


