Announcing the General Availability of Splunk RUM Custom Events
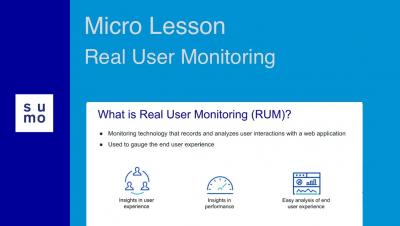
With a 70% increase in internet usage, and digital teams adopting cloud-native technologies at a rapid rate, the importance of measuring customer experience on digital properties is not just a technical problem, but a business imperative. Frontend developers and SREs use Real User Monitoring (RUM) to understand critical components of their end-user experience, like how quickly users see content, when a page becomes interactive, and a page's visual stability.