Operations | Monitoring | ITSM | DevOps | Cloud

The latest News and Information on Monitoring for Websites, Applications, APIs, Infrastructure, and other technologies.

Netdata and StackPulse: Per-second metrics meet automated remediation

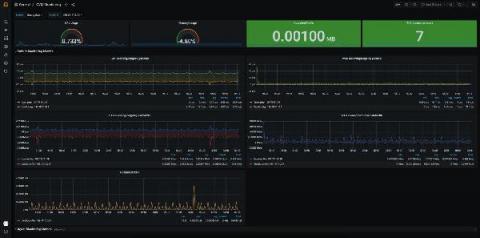
Teams of all types use Netdata to monitor the health of their nodes with preconfigured alarms and real-time interactive visualizations, and when incidents happen, they troubleshoot issues with thousands of per-second metrics on Netdata Cloud. But based on the complexity of the team and the infrastructure they monitor, some parts of their incident management, such as pre-planned communication and escalation processes, or even automated remediation, need to happen outside of the Netdata ecosystem.

Auvik Road Map Webinar - Q4 2020

Since our last roadmap update in May, we’ve released syslog, integrations with multiple new apps like ServiceNow, a new and improved application classifier in TrafficInsights to better identify your traffic mix, and a whole lot more. Now, we invite you to a sneak peek into what’s ahead for the rest of 2020 and early ‘21. Auvik VP of Product Management Patrick Albert will walk you through what’s on the Auvik development calendar and what features and functionalities you can expect to see on your dashboard in the coming months.

Tackling networking issues between users and cloud apps

By extending the capabilities of traditional network visibility, cloud adoption no longer comes at the cost of losing control over the quality of mission-critical systems. Even when employees can connect to an app from a mobile phone via places like a crowded airport Wi-Fi, with Flowmon's support of the cloud-native Packet Mirroring function, NetOps can ensure smooth service. This session will demonstrate how to identify the precise nature and origin of networking issues between your clients and apps hosted in Google Cloud Services.

Jaeger Essentials: Introduction to Jaeger Instrumentation

Every journey in distributed tracing starts with instrumenting an application to emit or extract trace data from each service as they execute. There are many ways to instrument, including the use of SDKs and pre-configured frameworks, and many protocols for transmitting the trace data to the analysis tool.

Entity empowered troubleshooting

Modern applications are sufficiently instrumented and complex, creating a swell of data that's hard to navigate, parse and understand without proper context. Entities provide the backbone of your data streams, enabling you to tie all the individual measurements back to the objects and their interactions that happen on your actual stack. By traversing entities and overlaying raw data, Sumo Logic can help tie together raw signals with root causes.