What is an Observability Data Pipeline?
I can’t remember the last time I drove down highway 101 between San Francisco and the South Bay and didn’t see a billboard claiming to be the single tool to solve all of my data problems.


The latest News and Information on Monitoring for Websites, Applications, APIs, Infrastructure, and other technologies.
I can’t remember the last time I drove down highway 101 between San Francisco and the South Bay and didn’t see a billboard claiming to be the single tool to solve all of my data problems.
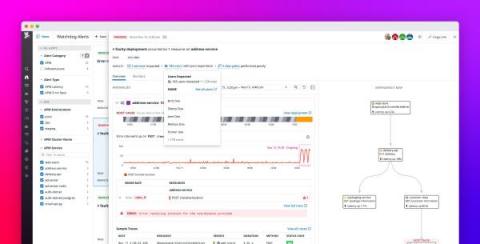
Watchdog is Datadog’s machine learning and AI engine, which leverages algorithms like anomaly detection to automatically surface performance issues in your infrastructure and applications. Without any manual setup or configuration, Watchdog generates a feed of Alerts—on anomalies such as latency spikes, elevated error rates, and network issues in cloud providers—to help you reduce your mean time to detection.
HashiCorp Cloud Platform (HCP) provides fully managed versions of some of HashiCorp’s most popular offerings, including Vault. With Vault, users have a centralized way to secure, store, and manage access to secrets across distributed systems. HCP Vault handles the day-to-day cluster maintenance, patches, and overall system security, making it easy to deploy a cluster without needing to host or manage your own infrastructure.
As one of the leading enterprise collaboration software globally, Microsoft Teams helps remote workers come together and stay productive. But while IT already has tools to monitor Teams call quality metrics, the pandemic shifted the organizational landscape with all of us working remotely from home. Or at least work in a hybrid way! So what does that mean for Teams monitoring now? The shift necessitates a newer Microsoft Teams monitoring strategy approach that combines synthetics with real user monitoring (RUM) to get a complete seamless digital experience.
The integration of Development and Operations is a powerful recent approach to software development. If you're new to DevOps practices, or looking to improve your current processes, it can be tough to know which tool is best for your team. We've put together this list to help you make an informed decision on which tools should be part of your stack. Read on to discover the 15 best DevOps tools, from automated build tools to application performance monitoring platforms.
A Webhook is an API that delivers data from applications when an action or event occurs. When an event is triggered within the source site, it is seen by the Webhook, which collects the data and sends it to the desired application or URL in the form of an HTTP request. Webhooks are also instant, triggering the delivery of data in real-time, this makes them faster and easier to implement than other methods, like polling.
When running and maintaining an application in a production environment, we want to feel confident about the behavior of the application and know when it isn’t working as expected. At the least, we want to track errors, monitor performance, and collect specific metrics throughout the application.