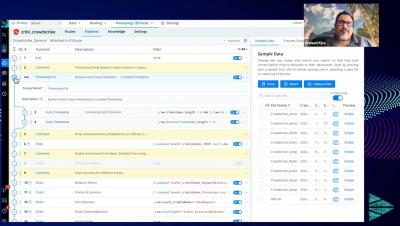
Latest Security Packs from Cribl
Learn more about the latest security Packs from the Cribl Pack Dispensary


The latest News and Information on Monitoring for Websites, Applications, APIs, Infrastructure, and other technologies.
The software industry is moving toward teams that own the services they build. This concept encloses principles and possibilities from movements toward microservices, DevOps, Agile, and Project to Product. In these paradigms, a team of people delivers software that provides valued capabilities. These capabilities help customers get their work done, support business operations, or enable other software to do these.
We are happy to announce that an official Google BigQuery data source plugin for Grafana has arrived! Based on the popular DoiT International BigQuery DataSource community plugin, the new Grafana BigQuery plugin brings a new and improved query editor experience plus support for all BigQuery data types, Grafana Alerting, and query caching.
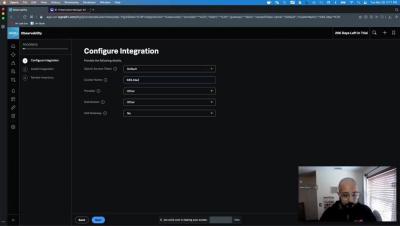
Many years ago, I attained my private pilot’s license. This entailed completing a very structured program, similar to how most companies introduce a product to a new user. Let’s be honest, there is a really good reason for this – to avoid the crash and burn. With flight training, it’s literal, while with products it’s a bit more figurative (except when you YOLO something into production–that can cause a crash and burn–and leave for a bad first impression).
This article was published in The New Stack. For most developers, software development means there is an API for almost everything, hardware is provisioned via the cloud and the core focus is on building only the features most crucial to your business. Of course, all these integrations and modern distributed architectures create their own set of problems. Having full insight into your application has become even more important and is now commonly known as observability.
Circular IT and Zero Waste Strategies are vital goals for eG Innovations. To support this initiative, we offer flexible licensing options that meet the needs of clients regardless of the solution they choose to employ.