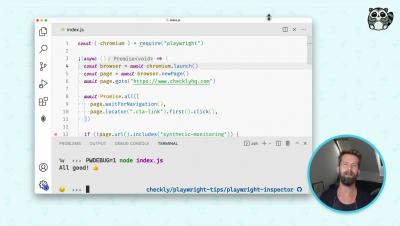
How to debug your Playwright scripts with the built-in inspector
Debugging a headless automation script can be tough. Luckily, Playwright comes with a built-in inspector tool to make all browser actions easier to debug.


The latest News and Information on Monitoring for Websites, Applications, APIs, Infrastructure, and other technologies.
The Microsoft CQD is rich with Teams data but for IT professionals, toggling between multiple dashboards can leave you feeling as though you might not have the visibility into Teams performance that you would like. For IT teams, configuring custom dashboards in Elasticsearch can take time and not always yield the results you are looking for.
We are halfway through 2022 and one thing is certain – downtime is here to stay. In fact, trends are showing the frequency of downtime is increasing, along with the severity and wide-spread impact. Consumers and businesses are more interconnected and reliant on technology and software than ever, from remote business communication to simply listening to your favorite podcast on your way to work.
Extended Berkeley Packet Filter (eBPF) is an exciting technology that provides secure, high-performance kernel programmability directly from the operating system. It can expose a wide range of applications and kernel telemetry that is otherwise unavailable. But with operating systems frequently processing very large volumes of network data, even with an efficient framework and cheap eBPF program runs, costs can add up quickly.
If you’re an InfluxDB user you might be considering migrating your workload to InfluxDB Cloud. You probably want to free yourself from the responsibilities associated with managing and serving your OSS account. Perhaps you are finding that you simply cannot scale your OSS instance vertically to meet your needs. Maybe you want to use all of the Flux functions that are available to you in InfluxDB Cloud.
We’re excited to announce that we’ve just released SquaredUp Dashboard Server 5.6! This Dashboard Server release covers multiple features that have been highly requested by the community. Prioritizing this user feedback, we’ve added some exciting new visualizations, features and enhancements. Read on to learn about the latest updates, or catch the full webinar recording at the bottom of the blog for a detailed demo by Senior Solutions Engineer Ashley Thompson.
No matter how well-designed, flashy, or useful your application is for your target users, they may not take kindly to it being slow or, even worse, crashing once in a while. You will lose customers and revenue as a result. The solution is definitely not to add additional features to the application to bring back users. Instead, it’s as simple as paying close attention to the health of the servers where your application is hosted.