Operations | Monitoring | ITSM | DevOps | Cloud

The latest News and Information on Monitoring for Websites, Applications, APIs, Infrastructure, and other technologies.

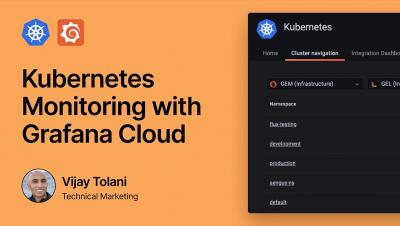
Kubernetes Monitoring in Grafana Cloud: Getting started

Reduce deployment, setup, and troubleshooting time with Kubernetes Monitoring in Grafana Cloud. Learn how to set up the new Kubernetes Monitoring solution in minutes so you can drill down through your infrastructure with the cluster navigation view to identify and resolve issues and much more.

Stream application logs into Cloud Logging

Do you have workloads that generate logs inside your Google Compute Engine (GCE) instances? Would you like to troubleshoot your application directly from Google Cloud Platform? Then check out this video to learn how to install and configure the Ops Agent to stream any third party application log into Cloud Logging.

OpenTelemetry Roadmap and Latest Updates

OpenTelemetry is one of the most fascinating and ambitious open source projects of this era. It’s currently the second most active project in the CNCF (the Cloud Native Computing Foundation), with only Kubernetes being more active. I was at KubeCon Europe last month, delivering a talk on OpenTelemetry and it was amazing to see the full house and the excitement and interest around the project.

How to Optimize Laravel Application Performance

With the growing pace of tech-oriented companies, software development is picking up. Many new tech stacks are coming into the world to make the development process easier, and a lot of these new companies are using PHP as the backend framework for their apps. PHP, with its various version updates, has grown popular among developers. Most PHP developers have heard and worked with Laravel at least once.

Lessons Learned From Running Serverless In Production For 5 Years

I have been an AWS customer since 2010 and in the early days I, along with just about everyone else on AWS, spent a lot of my time just managing infrastructure. Patching AMIs, configuring load balancers, updating auto-scaling configurations, and so on. It was the sort of thankless task that no one cared about until something went wrong! The very definition of what Werner Vogel often refers to as “undifferentiated heavy-lifting”.

Automate Your Boring Stuff with Python

In many critical areas, you can automate the completion of repetitive chores in an efficient and effective manner by using a computer language such as Python. When you are just starting out, it’s vital to understand the fundamentals of Python via coding examples. However, if you want to improve your Python skills, you should concentrate on constructing things and automating real-world tasks.

How to access and query REST APIs with the Sqlyze plugin in Grafana

A few months ago, I wrote about using the Sqlyze data source plugin in Grafana to query COVID-19 wastewater surveillance data on Databricks. Did you know that with the Sqlyze Enterprise plugin, you can also access REST APIs (web services), treat them as database tables, and query them using SQL? You can use any ODBC driver you like, and it’s not limited to relational databases, either. You can query NoSQL and document databases, too.

5 Downdetector Alternatives: Is There a Better Way to Know if a Service Is Down?

Downdetector is a platform that displays the current status of internet services, websites, mobile apps, and providers. The information is crowdsourced from users who report issues as they come across them. Downdetector is a popular service. Nowadays, organizations depend on a huge variety of services and so need to have the most reliable and detailed view of everything that’s going on.

Investigating digital experience with Synthetic Transaction Monitoring

Kentik Synthetics is all about proactively testing and monitoring specific elements of your network, the services it relies on, and the applications it delivers. That means using artificial traffic instead of end-user traffic to test a variety of aspects of digital experience monitoring like device availability, DNS activity, web application page load times, and BGP activity. But to test an end-user’s experience interacting with a website, we need to approach things differently.