Operations | Monitoring | ITSM | DevOps | Cloud

Monitoring

The latest News and Information on Monitoring for Websites, Applications, APIs, Infrastructure, and other technologies.

Is your ITSM platform scaling with your operations? This Case Study will help you find the answer.

The client in consideration is one of the largest engineering, procurement, and construction (EPC) companies in India. With projects covering over 14 states in the country, its portfolio of services and offerings is widely diversified. It primarily engages in three forms of businesses – civil construction, road & highway development, and manufacturing.

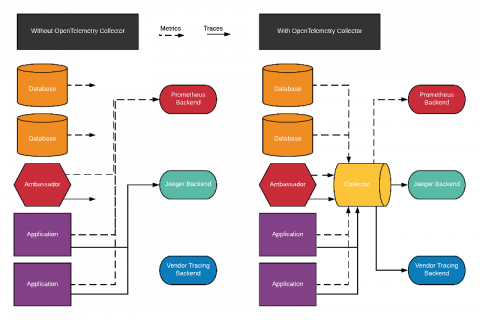
Configuring the OpenTelemetry Collector

The OpenTelemetry Collector is a new, vendor-agnostic agent that can receive and send metrics and traces of many formats. It is a powerful tool in a cloud-native observability stack, especially when you have apps using multiple distributed tracing formats, like Zipkin and Jaeger; or, you want to send data to multiple backends like an in-house solution and a vendor. This article will walk you through configuring and deploying the OpenTelemetry Collector for such scenarios.

Full Observability with Your Node.js App

Javascript is a pretty prolific programming language, used daily by people visiting any number of websites and web applications. NodeJS, it’s server-side version, is also used all over the place. You’ll find it deployed as full application stacks to functions in things like AWS Lambda, or even as IoT processes with things like Johnny Five. So when we think about Observability in the context of a nodejs stack, how do we set it up and get the information flowing?

Complete Guide to Script Errors: What Are They and How to Fix Them

Do you use an error tracking tool for your website? Have you ever tried to debug a problem that a user reported, and when you looked at your error tracking tool the reported error was simply: “Script Error”? Such errors are impossible to further debug because there is no additional information apart from that message.

Splunk Recognized as Value Leader in EMA Radar Report: AIOps, A Guide for Investing in Innovation

Splunk has been recognized as a Value Leader in EMA’s latest research, Radar Report: AIOps, A Guide for Investing in Innovation. Vendors were evaluated across three categories, with Splunk listed as a Value Leader in both ‘Incident, Performance, and Availability Management’ and ‘Business Impact and IT-To-Business Alignment’, as well as Strong Value in ‘Change Impact and Capacity Optimization’.

How Grafana Labs is reorganizing for growth

As you most likely know, Grafana Labs is growing. Growing like crazy! As Goutham Veeramachaneni noted in his blog post, “~30 people in March 2018 and now, in August 2020 we’re 180+ people. That is 6x growth in 2.5 years.” And we have no intention of slowing that growth. Matter of fact, we’re hiring as quickly as we can — and on top of that keep hiring specialists just to scale out hiring even more.

The Future of Anomaly Detection

You may be using your log data in a completely wrong way. Today, your business produces more data than ever before, and log data is at the center of all this because it contains the signals of what caused a problem. If your teams have to search for these signals in an ad-hoc manner, then they are wasting their precious time. Nearly every company in existence is dealing with this challenge because it may not have the tools to filter these signals from the noise.

Getting Started with Sending StatsD Metrics to Telegraf & InfluxDB

This tutorial will walk you through sending StatsD metrics to Telegraf. StatsD is a simple protocol for sending application metrics via UDP. These metrics can be sent to a Telegraf instance, where they are aggregated and periodically flushed to InfluxDB or other output sinks that you have configured. At the time of writing, we have 37 different output plugins supported.

Markley Group Gains Better Visibility, Automation with OpsRamp

Markley Group is a Boston-based data center leader that provides co-location and private cloud services through a three-million square foot data center portfolio. The company was founded in 1991, when there was no such thing as the cloud. Today, many of its customers are experimenting in public cloud but often have workload requirements which are better suited or more affordable running on private infrastructure, according to Patrick Houston, Director of Engineering at Markley Group.