The latest News and Information on Monitoring for Websites, Applications, APIs, Infrastructure, and other technologies.
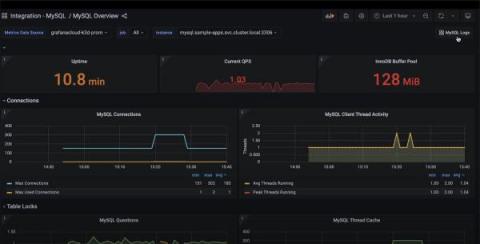
Today, we are excited to announce that the MySQL integration has received an important update, which includes a new pre-built MySQL logs dashboard and the Grafana Agent configuration to view and collect MySQL server logs. The integration is already available in Grafana Cloud, our platform that brings together all your metrics, logs, and traces with Grafana for full-stack observability.
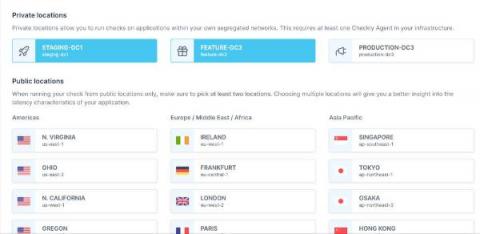
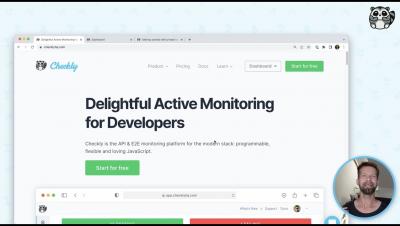
The monitoring and testing of public applications and APIs is challenging by itself. What should you test? How often should you run your tests? And who should be alerted? A scalable monitoring setup includes many hidden details, but technically it’s straightforward. Call public APIs and see if they do what they’re supposed to.
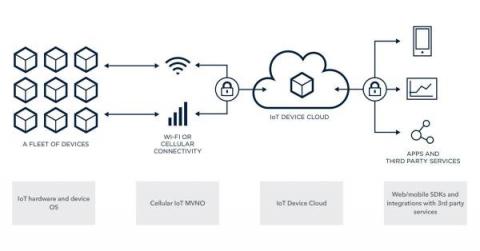
The Particle platform enables companies to manage and program their IoT devices, bringing them to market quicker. To accomplish this, Particle developers needed to be able to collect telemetry data from a large number of edge IoT devices to measure performance. A key benefit of the Particle platform is its ability to scale from prototype to enterprise. Developers often prototype IoT devices using microcontrollers like Arduino or Raspberry Pi.
For the next interview in our series speaking to technology specialists from around the world, we’ve welcomed experienced CTO, Leonard Trigg. Leonard is a member of the Harbourfront executive management team and serves as the firm's Chief Technology Officer. Joining the industry in 1995 Leonard has a background in enterprise technology, finance and operations. Leonard previously served as the Chief Operating Officer and Director at Vertex One Asset Management Inc.
We offer a free trial period to ensure that our customers use MetricFire successfully. But often when someone signs up for a trial they may not know where to start. This is a guide on how to use your trial to test your data and see if MetricFire is right for your use case. Each use case is different so it is important to book a call with our technical support team so we can help you utilize your free trial optimally for you. Create a MetricFire account for free and see how our system works.
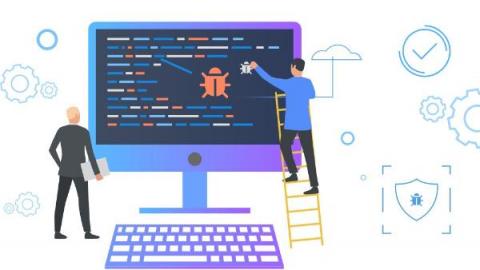
Debugging is an essential step in software development, as it allows developers to fix errors before releasing the software to the public. Debugging tools can be integrated into code editors, making the debugging process more efficient. This tutorial will show you how to debug node.js in Visual Studio Code.