Operations | Monitoring | ITSM | DevOps | Cloud

Tracing

The latest News and Information on Distributed Tracing and related technologies.

APM vs Tracing vs Observability

Application Performance Monitoring (APM), tracing, and observability are fundamental software development and system management approaches. Each of these three concepts uniquely ensures that your applications operate, efficiently, smoothly, and reliably. Your organisation will more than likely already adopt one of these approaches, or even two, potentially all three.

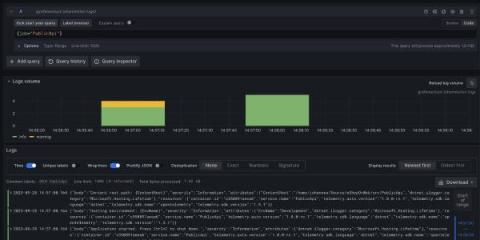
How to configure OpenTelemetry .NET Automatic Instrumentation with Grafana Cloud

For those who have limited experience with OpenTelemetry, it can be intimidating to instrument.NET applications. But the OpenTelemetry community created a welcome shortcut with the first stable release of.NET Automatic Instrumentation. It simplifies the process of collecting metrics, logs, and traces from your.NET applications, without applying any changes to the source code or adding any dependencies to the OSS project.

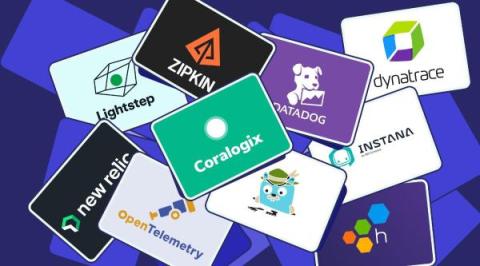
Top 10 Distributed Tracing Tools For Your Success

In the intricate web of modern software systems and full-stack observability, knowing how requests flow and interact across distributed components is paramount. Distributed tracing tools can help you. To better understand how distributed tracing works and benefits, here’s our selection of top distributed tracing tools to choose from.

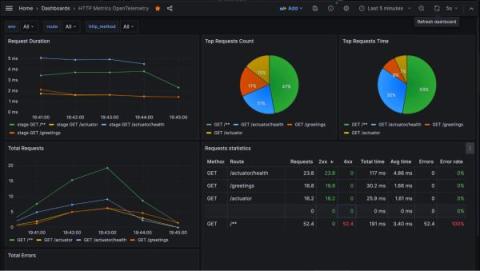
How to integrate a Spring Boot app with Grafana using OpenTelemetry standards

Maciej Nawrocki, Senior Backend Developer at Bright Inventions, is a backend developer focused on DevOps and monitoring. Adam Waniak, Senior Backend Developer at Bright Inventions, is a backend developer with a keen interest in DevOps. Bright Inventions is a software consulting studio based in Gdansk, Poland, with expertise in mobile, web, blockchain, and IOT systems. At Bright Inventions, we always prioritize app optimization when we develop software solutions for our clients.

Azure Functions Distributed Tracing

In today’s cloud-centric, serverless computing landscape, applications are increasingly distributed and complex, composed of numerous microservices, functions, and external dependencies. Azure Functions, a serverless compute service offered by Microsoft Azure, plays a pivotal role in building scalable, event-driven applications.

Elastic's contribution: Invokedynamic in the OpenTelemetry Java agent

As the second largest and active Cloud Native Computing Foundation (CNCF) project, OpenTelemetry is well on its way to becoming the ubiquitous, unified standard and framework for observability. OpenTelemetry owes this success to its comprehensive and feature-rich toolset that allows users to retrieve valuable observability data from their applications with low effort. The OpenTelemetry Java agent is one of the most mature and feature-rich components in OpenTelemetry’s ecosystem.

How OpsRamp Closes the Complexity Gap with Distributed Tracing

As distributed, interconnected microservices have replaced monolithic applications, application monitoring has had to evolve to support these modern, complex architectures. Rather than monitoring a single application and code base, organizations need to monitor the performance and network connectivity of multiple services that interact with each other.

Head Based Sampling using the OTEL Collector

This is part three in a series where I learn OpenTelemetry (OTEL) from scratch. If you haven't yet seen them yet, part 1 is about setting up auto-instrumented tracing for Node.js and part 2 is where I initially implemented the OTEL collector. Today we are going to begin experimenting with sampling. We need to sample traces because we capture so much data! It would be impractical to process and store it all (in most cases).