Operations | Monitoring | ITSM | DevOps | Cloud

Tracing

The latest News and Information on Distributed Tracing and related technologies.

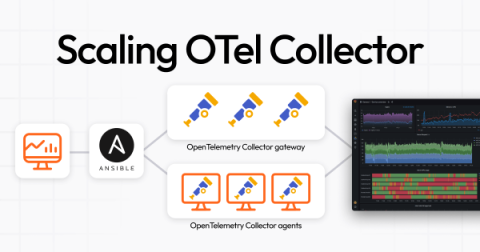
A guide to scaling OpenTelemetry Collectors across multiple hosts via Ansible

OpenTelemetry has emerged as a key open source tool in the observability space. And as organizations use it to manage more of their telemetry data, they also need to understand how to make it work across their various environments. This guide is focused on scaling the OpenTelemetry Collector deployment across various Linux hosts to function as both gateways and agents within your observability architecture.

Migrating from Elastic's Go APM agent to OpenTelemetry Go SDK

As we’ve already shared, Elastic is committed to helping OpenTelemetry (OTel) succeed, which means, in some cases, building distributions of language SDKs. Elastic is strategically standardizing on OTel for observability and security data collection. Additionally, Elastic is committed to working with the OTel community to become the best data collection infrastructure for the observability ecosystem.

Real User Monitoring With a Splash of OpenTelemetry

You're probably familiar with the concept of real user monitoring (RUM) and how it's used to monitor websites or mobile applications. If not, here's the short version: RUM requires telemetry data, which is generated by an SDK that you import into your web or mobile application. These SDKs then hook into the JS runtime, the browser itself, or various system APIs in order to measure performance.

Mastering OpenTelemetry - Part 1

In the complex world of modern distributed systems, observability is vital. Observability allows engineers to understand what's happening within their systems, debug issues rapidly, and proactively ensure optimal application performance. OpenTelemetry has emerged as a powerful, vendor-neutral solution to address the challenges of observability across different technologies and environments.

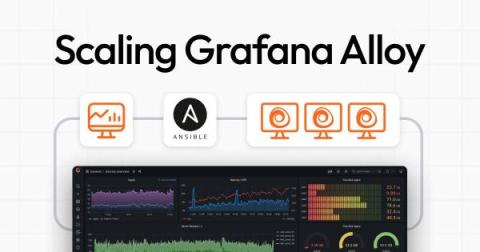
A guide to scaling Grafana Alloy deployments across multiple hosts

Last week we introduced Grafana Alloy, our distribution of the OpenTelemetry Collector with built-in Prometheus pipelines and support for metrics, logs, traces, and profiles. We’re excited to see the community embrace Alloy, and we want to help them use and scale it as easily as possible. Many developers that need to deploy and manage software across several hosts turn to Ansible for its ease of use and versatility.

Enhancing Data Ingestion: OpenTelemetry & Linux CLI Tools Mastery

While OpenTelemetry (OTel) supports a wide variety of data sources and is constantly evolving to add more, there are still many data sources for which no receiver exists. Thankfully, OTel contains receivers that accept raw data over a TCP or UDP connection. This blog unveils how to leverage Linux Command Line Interface (CLI) tools, creating efficient data pipelines for ingestion through OTel's TCP receiver.

Implementing Jaeger for Distributed Tracing in Microservices

Earlier, applications were mostly monolithic, meaning that several programs were written in the same language and placed in the same web stack. However, it is no longer the case today. Today, every software is comprised of several small application programs coming together each providing a service of its own. These applications are what we call microservices.

Integrations for new Data Sources, Upgrades to Alerts & Kubecon Paris - SigNal 35

Welcome to the 35th edition of our monthly product newsletter - SigNal 35! We have made significant advancements in enhancing our product. The integration feature we shipped will enable quick-start monitoring for popular technologies in SigNoz. Let’s see what humans of SigNoz were up to in the month of March 2024.

Observing Core Web Vitals with OpenTelemetry: Part Two

Core Web Vitals (CWV) are Google's preferred metrics for measuring the quality of the user experience for browser web apps. Currently, Core Web Vitals measure loading performance, interactivity, and visual stability. These are the main indicators of what a user’s experience will be while using a web page: Note: As of March 12th, INP has become a stable Core Web Vital, replacing First Input Delay (FID).