Operations | Monitoring | ITSM | DevOps | Cloud
Tracing
The latest News and Information on Distributed Tracing and related technologies.
OpenTelemetry metrics: A guide to Delta vs. Cumulative temporality trade-offs
In OpenTelemetry metrics, there are two temporalities, Delta and Cumulative and the OpenTelemetry community has a good guide on the different trade-offs of each. However, the guide tackles the problem from the SDK end. It does not cover the complexity that arises from the collection pipeline. This post takes that into account and covers the architecture and considerations that are involved end-to-end for picking the temporality.
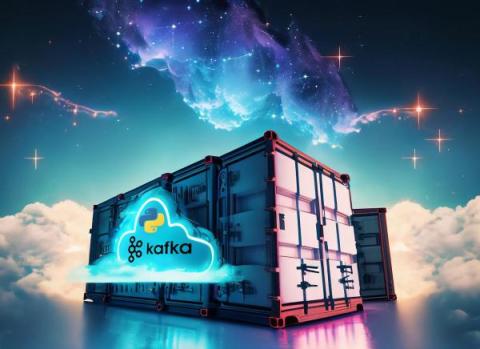
Auto-Instrumenting OpenTelemetry for Kafka
Apache Kafka, born at LinkedIn in 2010, has revolutionized real-time data streaming and has become a staple in many enterprise architectures. As it facilitates seamless processing of vast data volumes in distributed ecosystems, the importance of visibility into its operations has risen substantially. In this blog, we’re setting our sights on the step-by-step deployment of a containerized Kafka cluster, accompanied by a Python application to validate its functionality. The cherry on top?
OpenTelemetry Webinar: What is the OpenTelemetry API
OpenTelemetry vs. OpenTracing
OpenTelemetry vs. OpenTracing - differences, evolution, and ways to migrate to OpenTelemetry.
Making design decisions for ClickHouse as a core storage backend in Jaeger
ClickHouse database has been used as a remote storage server for Jaeger traces for quite some time, thanks to a gRPC storage plugin built by the community. Lately, we have decided to make ClickHouse one of the core storage backends for Jaeger, besides Cassandra and Elasticsearch. The first step for this integration was figuring out an optimal schema design. Also, since ClickHouse is designed for batch inserts, we also needed to consider how to support that in Jaeger.
Auto-Instrumenting Node.js with OpenTelemetry & Jaeger
Six months ago I attempted to get OpenTelemetry (OTEL) metrics working in JavaScript, and after a couple of days of getting absolutely no-where, I gave up. But here I am, back for more punishment... but this time I found success! In this article I demonstrate how to instrument a Node.js application for traces using OpenTelemetry and to export the resulting spans to Jaeger. For simplicity, I'm going to export directly to Jaeger (not via the OpenTelemetry Collector).


