Operations | Monitoring | ITSM | DevOps | Cloud

Tracing

The latest News and Information on Distributed Tracing and related technologies.

How to Monitor MySQL Metrics with OpenTelemetry

Database monitoring is an important aspect to look at for a high-volume or high-traffic system. The database performance drastically impacts the response times for the application. In this tutorial, you will install OpenTelemetry Collector to collect MySQL metrics and then send the collected data to SigNoz for monitoring and visualization. In this tutorial, we cover: If you want to jump straight into implementation, start with this pre-requisites section.

How to Collect .NET Application Logs with OpenTelemetry

In the realm of modern software development, achieving true observability is paramount for understanding application behavior and performance. This demonstration focuses on a.NET application that harnesses the capabilities of OpenTelemetry to seamlessly integrate logging and tracing functionalities. OpenTelemetry, a key player in the Cloud Native Computing Foundation, provides a unified framework for comprehensive observability.

How to Monitor Prometheus Metrics with OpenTelemetry Collector?

OpenTelemetry provides a component called OpenTelemetry Collector, which can be used to collect data from multiple sources. Prometheus is a popular metrics monitoring tool that has a wide adoption. If you’re using Prometheus SDKs to generate metrics, you can collect them via OpenTelemetry collector and send them to a backend of your choice.

How to Monitor Apache Server Metrics with OpenTelemetry

Monitoring Apache web server metrics ensures your web server performs efficiently, securely, and reliably. In this tutorial, you will configure OpenTelemetry Collector to collect Apache metrics and send them to SigNoz for monitoring and visualization. We cover: If you want to jump straight into implementation, start with this prerequisites section.

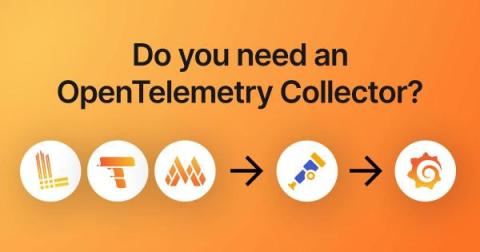
Do you need an OpenTelemetry Collector?

When you use OpenTelemetry SDKs to collect logs, metrics, and traces from infrastructure or an application, you’ll find many references to people using Grafana Agent and OpenTelemetry Collector. They start with an application or infrastructure that sends telemetry, and that data is sent to a collector, which then sends it to a backend like Grafana that may perform many functions, including visualization.

The Leading Jaeger Dashboard Examples

Unlocking the full potential of observability and tracing in modern software ecosystems has become imperative for businesses striving to deliver improved reliability and user experience. In this comprehensive roundup, we will dive into the world of Jaeger-incorporated observability and tracing dashboards, offering a curated selection of the best use cases that empower DevOps teams, engineers, and developers to gain unparalleled insights into the inner workings of their applications.

How Pipedrive switched its observability stack to OpenTelemetry & LGTM | ObservabilityCON 2023

The cloud-based CRM company Pipedrive has been relentlessly modernising its observability stack, first adopting Grafana visualisation and Grafana Mimir for Prometheus metrics, then recently completed a migration of its distributed tracing from a third-party SaaS provider to OpenTelemetry and Grafana Tempo, and its logging stack from Graylog to Grafana Loki. Along the way, the team developed its own in-house library to include OpenTelemetry in its roughly 750 microservices.

OpenTelemetry Java Tutorial | Auto-Instrument Java App with OpenTelemetry

OpenTelemetry stands at the forefront of modern observability practices, revolutionizing how developers gain insights into their applications' performance and behavior. As a powerful distributed tracing framework, it empowers engineers to effortlessly instrument their applications, providing comprehensive visibility into the intricacies of microservices architectures. This tutorial discusses how OpenTelemetry can be used to get insights from a Java application.

OpenTelemetry Operator Complete Guide [OTel Collector + Auto-Instrumentation Demo]

Manually deploying and managing OpenTelemetry components in a Kubernetes environment can be a complex and time-consuming task. It involves creating various Kubernetes resources, setting up configurations, and ensuring the components are properly integrated with the applications.

Announcing the Splunk Add-on for OpenTelemetry Collector

The Splunk Add-on for OpenTelemetry Collector is a variation of the Splunk Distribution of the OpenTelemetry Collector that simplifies metrics and traces data collection, configuration and management. Since it is an add-on, users can deploy it alongside Universal Forwarders using tools like Deployment Server to start collecting high-fidelity metrics and traces from 1000s of their hosts easily. We’re happy to announce that the Add-On is now generally available in Splunkbase.