Operations | Monitoring | ITSM | DevOps | Cloud

Tracing

The latest News and Information on Distributed Tracing and related technologies.

Distributed tracing with Grafana Cloud k6 (Grafana Office Hours #14)

Senior Software Engineer Łukasz Gut talks about a new feature: Distributed Tracing with Grafana Cloud k6. He discusses what distributed tracing is, why it matters, and how it can help teams find reliability issues faster. He is joined by Developer Advocates Marie Cruz and Nicole van der Hoeven.

How to Monitor SQL Server with OpenTelemetry

At observIQ, we've seen growing interest in observing the health of Windows systems and applications using OpenTelemetry. Requests on the SQL Server receiver continue to garner the most interest, so let's start there. Below are steps to get up and running quickly with the contrib distribution of the OpenTelemetry collector. We'll be collecting and shipping SQL Server metrics to a popular backend, Google Cloud.

An overview of Context Propagation in OpenTelemetry

In today's rapidly evolving landscape of software applications, where complexity often thrives, the need for observability and tracing has never been more pronounced. The ability to comprehend the inner workings of distributed systems and track the journey of requests as they traverse through various components is paramount for maintaining optimal performance and troubleshooting issues. This is where OpenTelemetry, a prominent observability framework, steps in.

OpenTelemetry Exporters - Types and Configuration Steps

In this post, we will talk about OpenTelemetry exporters. OpenTelemetry exporters help in exporting the telemetry data collected by OpenTelemetry. OpenTelemetry frees you from any kind of vendor lock-in by letting you export the collected telemetry data to any backend of your choice. In modern distributed systems, efficiently collecting, transmitting, and analyzing telemetry data from diverse sources poses a significant challenge.

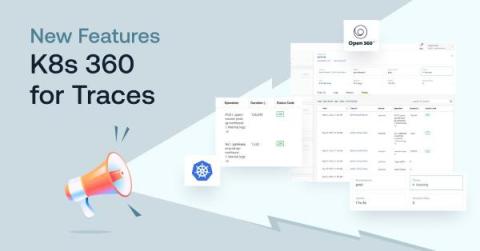
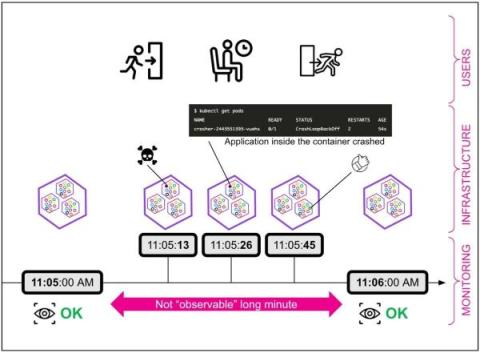
Tracing Your Steps Toward Full Kubernetes Observability

Kubernetes is one of the most important and influential technologies for building and operating software today because it’s so incredibly capable. It’s flexible, available, resilient, scalable, feature-rich and backed by a global community of innovators — that’s a pretty impressive list of intangibles to apply to any particular capability.

Why Does Observability Need OTel?

To successfully observe modern digital platforms, a new data collection approach was needed. And OpenTelemetry (OTel) was the answer - an industry-agreed open standard - not a single vendor's approach - on how observability (O11y) data should be collected from a platform. This separates out data collection from the vendors’ platform of data processing and visualisation, making the data collecting approach vendor agnostic.

How to Install and Configure an OpenTelemetry Collector

In the last 12 months, there’s been significant progress in the OpenTelemetry project -- arriving in the form of contributions, stability, and adoption. Being such, it felt a good time to refresh this post, providing project newcomers a short guide to get up and running quickly. In this post, I'll step through.

What's New in OpenTelemetry?

OpenTelemetry (OTEL) is an observability platform designed to generate and collect telemetry data across various observability pillars, and its popularity has grown as organizations look to take advantage of it. It’s the most active Cloud Native Computing Foundation project after Kubernetes, and it’s progressing at an immense pace on many fronts. The core project is expanding beyond the “three pillars” into new signals, such as continuous profiling.

Introducing the Prometheus Java client 1.0.0

PromCon, the annual Prometheus community conference, is around the corner, and this year I’ll have exciting news to share from the Prometheus Java community: The highly anticipated 1.0.0 version of the Prometheus Java client library is here! At Grafana Labs, we’re big proponents of Prometheus. And as a maintainer of the Prometheus Java client library, I highly appreciate the support, as it helps us to drive innovation in the Prometheus community.