The latest News and Information on Monitoring for Websites, Applications, APIs, Infrastructure, and other technologies.
As per research published by Hosting Advice, over 56% of employees who felt disengaged at work marked inadequate training as the key reason for it. Over 53% of employees felt that they would be able to perform better at their jobs if they received adequate training. And over 31% of respondents to the research survey stated that they had to quit their jobs less than six months after being hired. Olivia was one of those last set of employees at her first job out of graduate school.
During PromCon, I gave a talk titled “The Future of Prometheus and its Ecosystem.” I want to share the key highlights with you.
The rapid pivot towards a remote workforce is forcing organizations to adopt a cloud-first approach faster than ever. We recently surveyed 500 IT decision-makers around the globe to ascertain their views on IT automation, cloud migration, and business continuity in the face of unexpected crises. The survey found that 87% of IT professionals agree that the current COVID-19 pandemic will cause organizations to accelerate their migration to the cloud.
As a developer, getting metrics from your application onto a Prometheus graph can seem daunting. We’ll look at analyzing your service to find the most useful places to add metrics, how to add that instrumentation, getting it exposed and scraped, and then basic queries to use those metrics on graphs. Check out another article of mine for general reference on instrumenting, this one on Prometheus metrics, or this comparison on instrumentation alternatives.
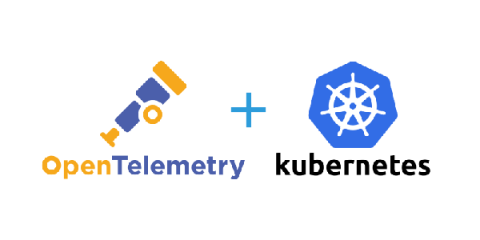
OpenTelemetry is an instrumentation standard for application monitoring - both for monitoring metrics & distributed tracing. In this blog, we take you through a hands on guide on how to run this on Kubernetes.