Operations | Monitoring | ITSM | DevOps | Cloud

The latest News and Information on Monitoring for Websites, Applications, APIs, Infrastructure, and other technologies.

Netreo Full-Stack Monitoring and Observability Suite Achieves Veracode Verified Standard Recognition

Netreo, the award-winning provider of IT infrastructure monitoring and observability solutions and one of Inc. 5000’s fastest growing companies, today announced that the Netreo full-stack IT infrastructure monitoring and Retrace by Netreo full lifecycle APM solutions have both earned Veracode Verified Standard recognition for proven security practices in application development.

Refined User Experience, New Executive Visibility, and Enhanced Cloud Monitoring with Splunk Enterprise Security 7.0

Just like that, another year has gone by full of remote work, virtual conferences, and lengthy Zoom calls. And, although we were not able to see our fellow Splunkers in person at.conf21 that didn’t stop us from previewing the latest enhancements to Splunk Enterprise Security. And now, it gives us great pleasure to announce that Enterprise Security 7.0 is available!

The Importance of Network Insights in Achieving Full End-To-End Observability

When we talk about observability, we tend to focus first and foremost on the metrics, logs, and traces that you can collect from applications – such as request rates, error rates, and request duration. Infrastructure-level metrics, like CPU and memory utilization, might factor into the discussion as well. Here’s a third category of critical observability insights that teams tend to overlook: the network.

Payment Optimization with AI-Based Analytics

The fintech market grows larger and more diverse each day. The financial news website Market Screener says the global fintech market will be worth $26.5 trillion by 2022, with an average annual growth rate of 6%. In Europe alone, the use of financial technology increased by 72% during 2020. Competition in this market segment is also on the rise.

What is End User Experience Monitoring? How Does It Help?

End user experience monitoring is a mindset and a philosophy. It’s the acknowledgement that IT is not the outcome, but rather a means to an end. Think of it this way: IT is here to support business operations. It does so by delivering technology to the tech-dependent workforce so employees can do their jobs seamlessly. Therefore, the most important thing to monitor in the IT ecosystem has shifted. It’s not the network, the device, or the cloud – these are only delivery mechanisms.

Collecting Metrics from Windows Kubernetes Nodes in AKS

Windows applications constitute a large portion of the services and applications that run in many organizations. When moving to a Kubernetes-based architecture, there is a need to support these as well. Up until April 2020, the lack of container support within the Windows operating system left Linux container images as the only viable option for Kubernetes container deployment.

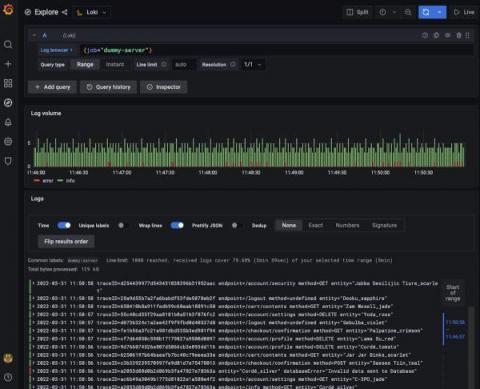
Configuring Grafana Tempo and Linkerd for distributed tracing

Anders Østhus is a DevOps Engineer on the Digital Tools team at Proactima AS, a consulting firm based in Norway that offers services and expertise in risk management, cybersecurity, healthcare, environmental solutions, and more. It can be difficult to orient yourself in the distributed tracing space, and getting all the parts of a tracing setup to play well with each other can be a bit tricky. But the benefits of tracing are undeniable.

How to deploy the Google Cloud Ops Agent with Ansible

Site Reliability Engineering (SRE) and Operations teams responsible for operating virtual machines (VMs) are always looking for ways to provide a more reliable, more scalable environment for their development partners. Part of providing that stable experience is having telemetry data (metrics, logs and traces) from systems and applications so you can monitor and troubleshoot effectively. Many Google Cloud services, including Google Compute Engine, provide basic system metrics out of the box.