Operations | Monitoring | ITSM | DevOps | Cloud

The latest News and Information on Monitoring for Websites, Applications, APIs, Infrastructure, and other technologies.

Enhancements to Alerting and Notification Functionality in Memfault

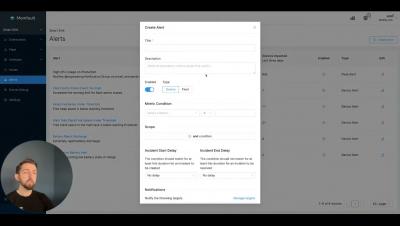
In this video, I will be discussing the new enhancements that we have made to the alerting and notification functionality within Memfault. These enhancements include configurable incident start and end delays, the ability to decide when your team receives notifications during an incident, and increased control over the scheduling of incident summary notifications. Our goal is to reduce noise without sacrificing visibility, giving users greater control over notification and alerting behaviors. Watch this video to learn how to take advantage of these new features and improve your monitoring experience.

Real user monitoring in Grafana Cloud: Get frontend error tracking, faster root cause analysis, and more

The frontend of a web application is the part that users directly interact with. It’s the last mile of the digital service you deliver to your customers and it’s directly associated with customer satisfaction and business objectives. Knowing performance metrics such as CPU or memory is helpful, but at the end of the day, what you care most about is if the user experience is affected.

AWS AI: Introduction to Amazon SageMaker, Amazon Rekognition, and Amazon Comprehend

Artificial intelligence (AI) and machine learning (ML), ever-evolving fields that are subtly and stunningly transforming our world, are now firmly rooted in most aspects of the current tech landscape and business processes. Their growth is exponential, and their effects are largely positive – fostering business endeavors, enhancing our quality of life, and shaping how we live, work, and interact.

The Great Network Observability Debate

You may have heard the term “network observability” regarding solutions that offer a deep and contextual view into the network. You’ve likely heard other terms, such as ‘network visibility,’ “network visualization” and of course “network monitoring.” But, experts argue, what these terms each truly means is still open for debate.

UNUM's Success Story with Vantage DX For Teams Meeting Rooms

As a distributed global organization with a hybrid workforce, UNUM, a Fortune 500 insurance company, faced unique technological challenges in managing its Microsoft Teams Rooms (MTRs). Research shows that approximately 3% of Microsoft Teams calls are poor or fail each day, with the vast majority caused by IT issues.

Monitor internal applications using private locations

When you need to monitor internal-facing APIs or private URLs that are behind your firewall, you need a secure solution. This is where private locations come into play. Private locations allow you to create custom locations in mission-critical areas of your business. If your customer relationship management platform goes offline, for example, you could lose customers and revenue.

Monitoring edge and fog computing devices

Edge computing and fog computing are technological advancements gaining traction in a hyper-connected world. Being close to the source, edge computing enables data collection and processing at the fastest possible speeds. Instead of sending all the data to a remote cloud location through the internet with latency, edge devices store and process most of it onsite and pass the heavy lifting to the central cloud to achieve the quickest turnaround.

A Detailed Guide to Docker Secrets

This post was written by Talha Khalid, a full-stack developer and data scientist who loves to make the cold and hard topics exciting and easy to understand. No one has any doubt that microservices architecture has already proven to be efficient. However, implementing security, particularly in an immutable infrastructure context, has been quite the challenge.

How to Use Google PageSpeed Insights Correctly: A Technical Guide

PageSpeed Insights is a Google web tool that analyzes web page performance and optimization. It provides valuable insights and recommendations to help website developers improve their websites’ speed and user experience. With this tool, we can better understand how a website performs on different devices and networks. In this post, we’re going to look at how to use it correctly, as well as giving you some technical tips along the way. Alright, let’s jump in!

Query unsampled logs in real time with Live Search

With thousands of logs generated every minute from your infrastructure, applications, services, and devices, retaining this copious amount of data for active search and analysis can be cost-prohibitive. Because log volumes continue to grow rapidly as operations scale, it’s common for organizations to implement log management strategies and store only a limited number to minimize costs.