Operations | Monitoring | ITSM | DevOps | Cloud


The latest News and Information on Monitoring for Websites, Applications, APIs, Infrastructure, and other technologies.

Evolving by Involving
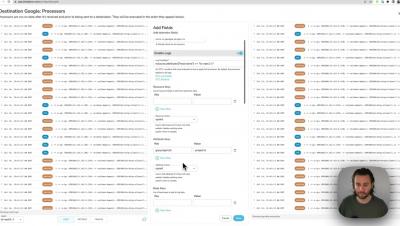
The customer success department at Honeycomb features a number of different roles dedicated to helping our customers succeed in every step of their observability journey. The work we do ranges from support engineers who provide timely assistance to customers, to customer architects who dive deep into the technical stuff, to product training who educate folks on features old and new.

Architectural Considerations for Your Cribl Stream Deployment
During our March Cribl User Group livestream, Cribl’s own Eugene Katz covered some of the updates we made to our documentation on Architectural Considerations for deploying Cribl Stream. Topics included our guidelines for determining the ideal number of worker nodes, accounting for throughput variability, and preparing for system failure. The full video has more information on these and other things to consider when determining the right balance between cost and risk for your organization.

What is an Elasticsearch index?
The term index is quite overloaded in the tech world. If you asked most developers what an index is, they might tell you it commonly refers to a data structure in a relational database (RDBMS) that is associated with a table, which improves the speed of data retrieval operations. But what is an Elasticsearch® index?

DX NetOps in Action: How Kyndryl Scaled SD-WAN Monitoring by 50%
Kyndryl is the world’s largest provider of IT infrastructure services, serving thousands of enterprise customers in more than 60 countries. The company has 4,400 customers, including 75 of the Fortune 100. The company designs, builds, manages, and modernizes the complex, mission-critical information systems that the world depends on every day. Kyndryl was formed when IBM spun off its Global Technology Services division in 2021.

Improving query performance in Grafana Mimir: Why we dropped mmap from the store-gateway
In recent months, we have been working on improving the performance of Grafana Mimir, the open source, horizontally scalable, highly available, multi-tenant TSDB for long-term storage of your metrics.

Top 5 Open Source Server Monitoring Tools
Engineers are increasingly embracing open-source server monitoring tools for their flexibility and cost-effectiveness. These tools offer functionality without the need for additional investments. In this article, we'll explore the top open-source server monitoring tools: Graphite, Grafana, ELK Stack, and Nagios. These actively maintained tools have thriving communities. Let's delve into their features and benefits.

Celebrating Artificial Intelligence Day: The role of AIOps in today's IT environments
In the ever-changing world of IT and digitalization, we’ve all probably pondered the same thought at least once: “Can AI ever replace me?” An example is the Tom and Jerry cartoon episode with the robot cat meant to replace Tom. Another is the video game Detroit: Become Human that navigates a world where self-aware androids surpass humans in intelligence. Fiction aside, we’re already seeing AI’s true capabilities with tools like Chat GPT and Bard.
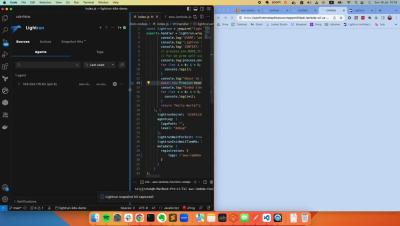
Debugging AWS Lambda Serverless with Lightrun

Connected networks = contented customers: 6 top network monitoring benefits
It's a typical day at work, and you're at your productive best. Just as you think you'll complete your task before the deadline, the network goes down. Sound familiar? However, at the other end are waiting customers who have items in their shopping cart, but are unable to complete transactions; potential prospects who want to try out a demo of your app, but now have doubts; and long-time loyal patrons who find the all-too-frequent interruptions frustrating..