Operations | Monitoring | ITSM | DevOps | Cloud
Monitoring
The latest News and Information on Monitoring for Websites, Applications, APIs, Infrastructure, and other technologies.
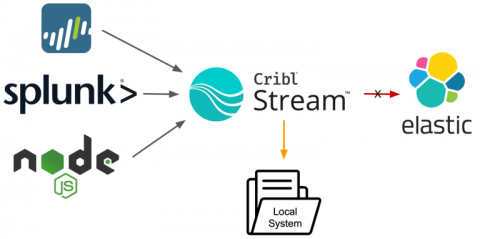
Source-Side Queueing: You Down With UDP?
Source-side queueing is a fancy way of saying: You can configure Cribl products to make sure data isn’t lost in the event of downstream backpressure, again. Those familiar with Cribl Stream might be aware of destination queuing or persistent queuing, wherein Stream can write data to the local disk in the event of an issue reaching the destination. Maybe your SIEM is suffering from disk I/O latency. Maybe there is a DNS problem with your load balancer (Hint: It’s always DNS).
Pricing comparison for Managed Prometheus
Observability has become a critical part of many companies and their business. So did requirements for the systems which collect and store business-critical metrics. Monitoring systems need to be reliable, scalable, fast, and preferably cost-effective. Such features of any monitoring system never come for free or out of the box – you need people, a team of professionals who can build and manage it.
A primer to understanding observability
The one certainty you will find in IT, developer, and SRE roles is that things always change! One hot topic in DevOps communities is observability. A long word, you may be wondering what it really means and how you can add it to your skillset. Here’s a quick primer to get you going on your path to observability.
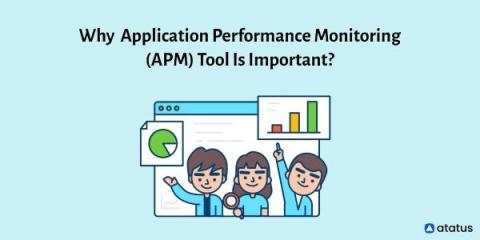
Why Application Performance Monitoring (APM) Tool Is Important?
Modern applications must deliver not only value but also round-the-clock availability, quick replies, and real-time problem-solving in today's digital economy. Since all businesses rely on software applications, their performance is one of their primary worries and frustrations, especially if their applications are the business itself. This is where Application Performance Monitoring Tool enters the scene.
Learn how our Chief Troublemaker transformed infrastructure troubleshooting.
Who Can Benefit From Kafka Monitoring Services?
The benefits of Apache Kafka monitoring services are widely appreciated across the industry. Organizations that rely heavily on Apache Kafka for their data streaming needs can derive great benefit from the use of Kafka monitoring services. By keeping track of various different key performance indicators (KPIs) related to Kafka, such as message throughput and latency, organizations can ensure that their Kafka-based data pipelines are running as smoothly and efficiently as possible.
Why does a business need middleware management?
In order to answer this question, it is necessary to define what middleware is. It is generally accepted that middleware is software that sits between existing systems and processes and helps to smooth integration and interaction between them. Because of the sheer range of middleware and the scope of what it can do and affect in terms of business infrastructure, it is vital that it can be successfully monitored and managed.
Optimize Device Refresh with Digital Experience Monitoring
Last year, during our Work Anywhere webinar, Forrester analyst Andrew Hewitt said that 51% of the technology teams focused on providing the right technology to enhance the employee experience. By 2021, the entire IT organization saw the need to support a flexible digital workplace with appropriate devices, wherever employees were located. According to computer economics, hardware such as PCs, laptops, and mobile devices age every four years. Therefore, device refresh becomes an important planning activity for support teams in keeping their knowledge workers productive and reducing the total cost of ownership (TCO).


