Operations | Monitoring | ITSM | DevOps | Cloud
Monitoring
The latest News and Information on Monitoring for Websites, Applications, APIs, Infrastructure, and other technologies.
AWS vs GCP: Top Cloud Services Logs to Watch and Why
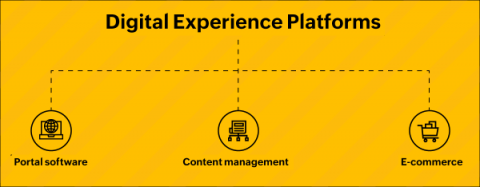
Digital experience and digital experience platforms, defined
Usually, people want a seamless experience when they interact with any organization. Whether a B2B or B2C interaction, the expectation is the same. In our world today, it's nearly impossible to interact with an organization without using technology. When a person interacts with an organization via a digital medium, it can be termed digital experience.
6 Common DynamoDB Issues
DynamoDB, the primary NoSQL database service offered by AWS, is a versatile tool. It’s fast, scales without much effort, and best of all, it’s billed on-demand! These things make DynamoDB the first choice when a datastore is needed for a new project. But as with all technology, it’s not all roses. You can feel a little lost if you’re coming from years of working with relational databases. You’re SQL and normalization know-how doesn’t bring you much gain.
Sentry Points of Presence: How We Built a Distributed Ingestion Infrastructure
Event ingestion is one of the most mission-critical components at Sentry, so it’s only natural that we constantly strive to improve its scalability and efficiency. In this blog post, we want to share our journey of designing and building a distributed ingestion infrastructure—Sentry Points of Presence— that handles billions of events per day and helps thousands of organizations see what actually matters and solve critical issues quickly.
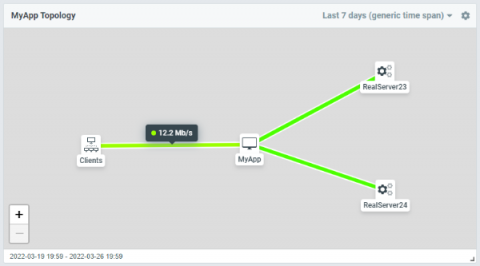
Flowmon and WhatsUp Gold: Discover application experience issues through single pane of glass
Have you ever experienced user complaints and struggled to find the root cause of the performance degradation? I'm sure every IT operations professional has. Is it the application? Is it the underlying infrastructure? Is it the network? What if you have a single pane of glass that will gather all the relevant metrics and telemetry and display it in an intuitive and easy to understand fashion?
How LogicMonitor Works: SaaS Platform Overview
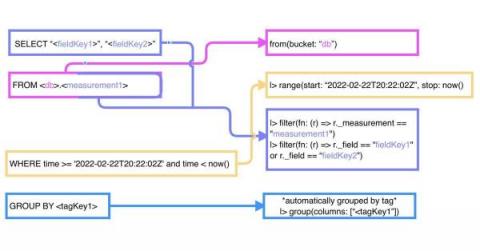
TL;DR InfluxDB Tech Tips: Converting InfluxQL Queries to Flux Queries
If you’re a 1.x user of InfluxDB, you’re most likely more familiar with InfluxQL than you are with Flux. To gain a deep understanding of Flux, it’s important to understand: However, you can still use Flux without studying those topics. In this TL;DR, we’ll convert common InfluxQL queries into Flux and identify patterns between the two languages to help you get started using Flux more easily if you come from a InfluxQL or SQL background.
Benefits of Localized Distributed Tracing
Distributed tracing is a household term nowadays – if your house is an IT department! Modern enterprises use cloud-native applications for agility and responsiveness to customer needs. When monitoring cloud-native applications, distributed tracing follows how transactions perform while traversing services or containers in the backend architecture. By definition, we’re describing production applications with requests, methods, database calls and logs that accompany a transaction.
Heartbeat check and more - is your monitoring still alive?
SIGNL4 is a cloud-based mobile alerting and incident response service. Third-party systems like monitoring tools, control systems or IoT sensors detect abnormalities and transmit events to SIGNL4 over the Internet. What if your systems cannot transmit critical events anymore? That might happen when the Internet is down or when the tool itself has a problem. In this case, SIGNL4 would miss critical events and could not turn them into alert notifications to your IT admins, technicians and experts.


