
Optimize Device Refresh with Digital Experience Monitoring

Device Refresh Becomes a Necessity
Last year, during our Work Anywhere webinar, Forrester analyst Andrew Hewitt said that 51% of the technology teams focused on providing the right technology to enhance the employee experience. By 2021, the entire IT organization saw the need to support a flexible digital workplace with appropriate devices, wherever employees were located. According to computer economics, hardware such as PCs, laptops, and mobile devices age every four years. Therefore, device refresh becomes an important planning activity for support teams in keeping their knowledge workers productive and reducing the total cost of ownership (TCO).
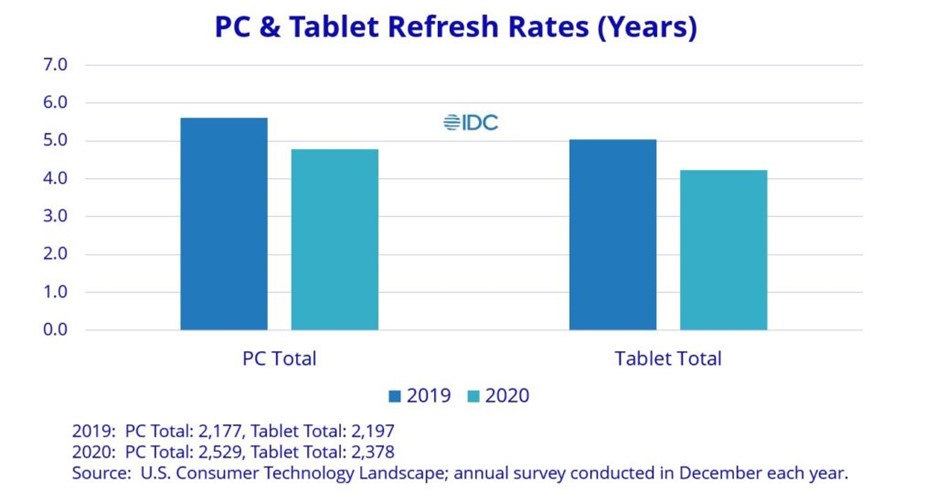
Interestingly, the consumer PCs and tablet refresh rates are dropping as shown in the chart above. This may be due to accelerating product consumerization, modern application resource and bandwidth usage requirements, rapid innovation in the chip industry, etc. As a result, someone within the IT infrastructure team needs to periodically ensure that all devices are fit for smooth business operations.
Ukraine Invasion, Chip Shortage, Supply Chain Challenges Continue
Market dynamics as we know today are swiftly changing. First, your knowledge workers may be in areas where they are constantly on the run. Second, although your company may be able to afford a large-scale device refresh deployment, chip shortages for laptops can keep you at bay.
Then, there’s the global supply chain problem which means that your team may not get their Dell or HP machines up and running in time. Constant disruptions in the world are getting out of control, even if your team may have scheduled device refreshes in advance.
And while the corporate world wants its employees to return to offices, there are undoubtedly several questions that need an answer.
How will support teams manage hardware refresh for a distributed workforce? Can we justify an expensive device refresh with our limited budget constraints? Is there a zero-touch approach to evaluating specific employee device needs? How many users actually need a hardware upgrade instead of an entire refresh?
This article discusses a better, faster, and more cost-effective way to manage your device refresh strategy from anywhere.
Closely Monitor Employee Device and User Experience
We all might start with the same laptop configuration upon joining a new company. But as time passes by, our machine usage varies according to increasing roles and responsibilities. For example – a software engineer who does programming every day will need more CPU on his computer for client-side computing. A sales analyst, on the other hand, will most likely need more memory to run his daily Microsoft Teams or Zoom calls to communicate with customers.
IT should care about meeting device needs for all individuals and see if the end-user is efficiently able to perform all of his or her tasks. Instead of replacing the slow laptop for the analyst who does most of their work with memory-consuming apps, upgrading memory will be a lot cheaper option. However, that’s just one data point.
Several other useful metrics also need to be factored into an objective analysis when making an upgrade or refresh decision. You may be able to tell which apps are running on the user’s device but not what experience the end-user has with their app.
Consider the below metrics for complete visibility into user endpoint devices.
- System
- Disk
- IO
- Ethernet
- Wi-Fi
- Signal
- Experience Score
When a laptop device approaches its device refresh cycle but the system metrics are healthy – its possible you can postpone a costly upgrade right away. Instead, prioritize users who have a poor desktop and application experience with their devices.
But how do you arrive at these actionable insights?
Endpoint Monitoring for Real-Time Insight
Launched last year, Exoprise Service Watch Desktop for digital experience monitoring provides IT with comprehensive visibility into device health performance. The tool collects 1000’s of system resources and application performance metrics for a desktop, network, Wi-Fi, signal, disk, etc., when the user is NOT idle. After analyzing these metrics, Service Watch generates a composite score for each resource type. Armed with these critical data points and device usage trends, administrators can monitor endpoints from anywhere and diagnose problems such as
- Slow SaaS applications and services
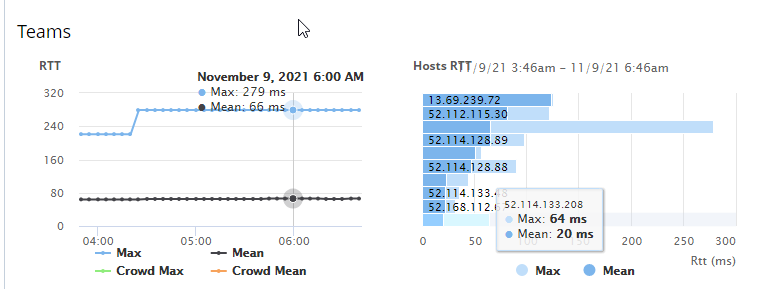
- Poor experience (Latency and packet loss) with Microsoft Teams, Zoom, Outlook, thick-client Desktop apps
- Intermittent Internet and Wi-Fi connectivity
- Faulty and corrupt application crashes
- Device hangs, freezes, and blue screen of death
So, the next time a user complains that their device is slow, investigate thoroughly with Service Watch and pinpoint the root cause. Let’s find out how.
Composite Metrics and Desktop Experience Scoring
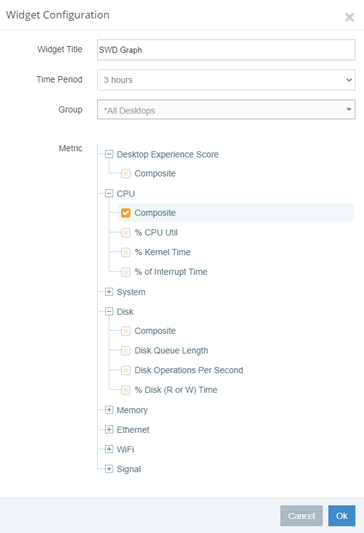
After deploying Service Watch Desktop on endpoint devices, get a high-level overview of the health and performance statistics of each employee device in an intuitive dashboard. Widgets and scorecards can be added and customized according to metrics (CPU, memory, system, etc.) you are interested in tracking. Additionally, each grid provides a deeper and more detailed sub-metric device information.
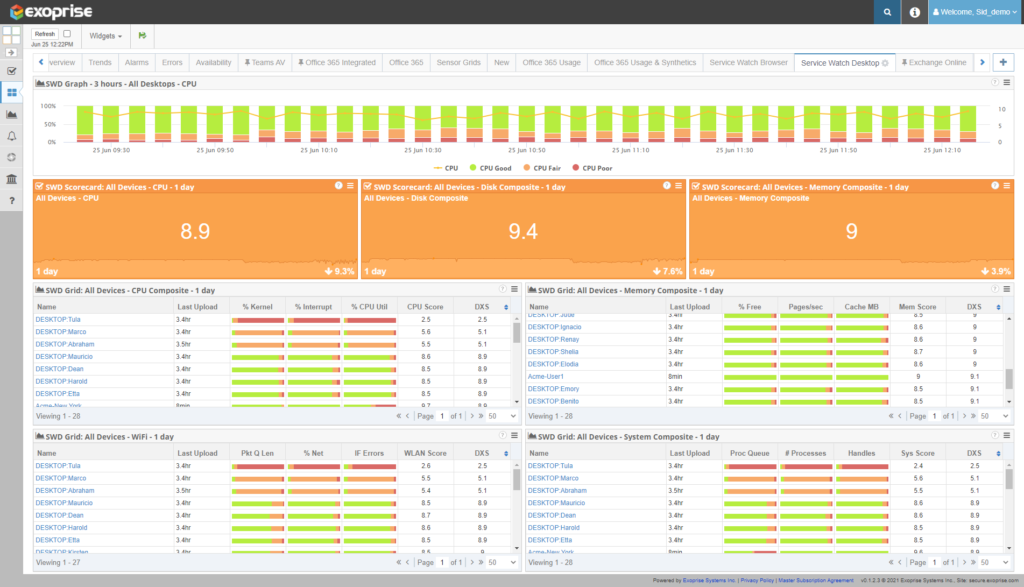
You will notice the scorecard and bar chart color change between green, orange, and red at different time intervals. Monitor trends and patterns of resource usage on employee devices.
Each composite scorecard metric reflects an aggregated, crowd-sourced, and benchmarked score. In addition, you will also see a Desktop Experience Score (DXS) for individual users.
You can also select different device groups (physical, virtual, Windows 10, Windows 7) to make your troubleshooting process more accurate.
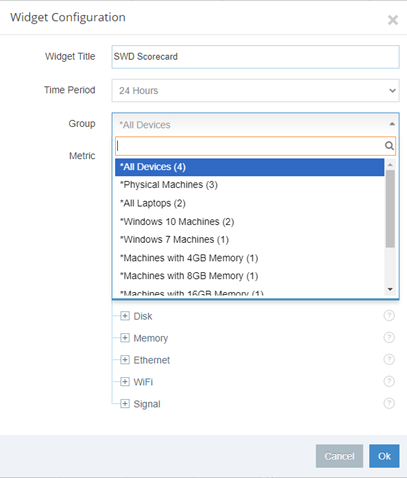
Sort the resource or DXS score column under different widgets and categories. For example, you can compare several device scores within a grid and select users with lower digital experience scores. Clicking on a device name takes you to the user device details page.
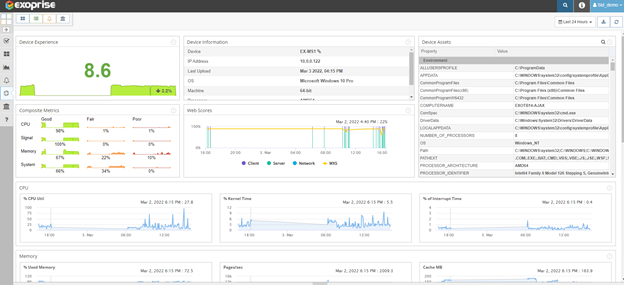
Drill Down into Individual Resource Consumption
Here you can see individual device profiles and information related to composite metrics, web scores, assets, CPU, and trends. Windows 10 or 7 native tools can provide some relevant information but say nothing about the experience with the device apps.
At the bottom of the dashboard, we show you four different tabs. One of which is the “Top App Performance” tab.
This section provides information on which apps consume the most system resources (CPU and memory). Remember, these usage figures can vary from person to person across the company. So, it is important to look at each specific device metric in detail to diagnose problems that end-users face.
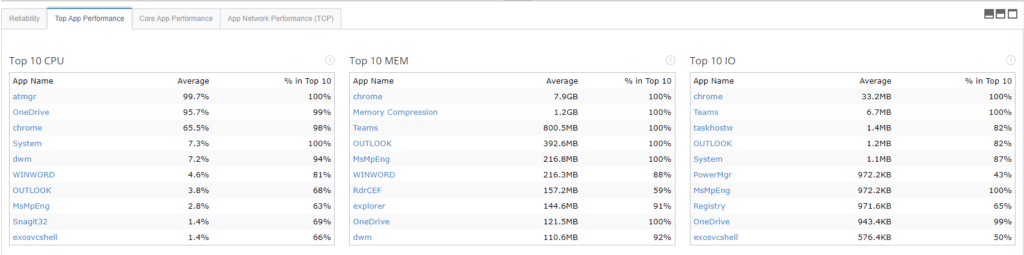
Now suppose there is a group of 5 team members from the same department who share the same laptop configuration. User ‘1’ experiences slowness when opening Microsoft 365 applications but the rest have an optimal (green) experience or memory score in the Service Watch Dashboard. You can narrow down the problem with the user ‘1’ machine.
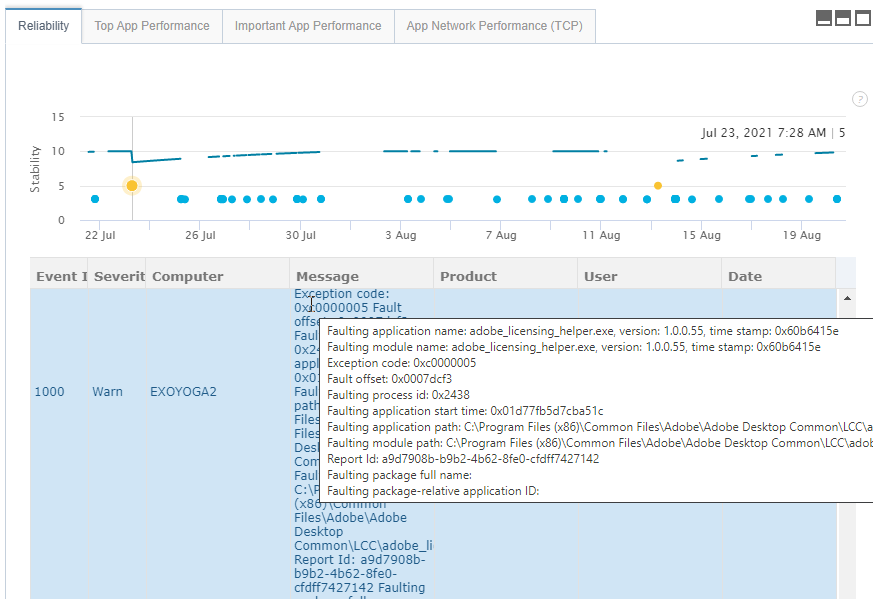
Upon further investigation, you notice that user ‘1’ downloaded an external third-party software that’s consuming a lot of CPU, memory, and IO. A possible software update may have corrupted the Teams application from opening. Exoprise can report on these program events under the “Reliability tab”. Rollback changes or uninstall programs to improve Device Stability index for user ‘1’.
As an administrator, there are several ways to use Exoprise Service Watch Desktop to troubleshoot and improve the digital end-user experience. Correlate resource scores with multiple objective data points from different sections of the Service Watch dashboard to make your digital workspace more productive.
Stay Hardware Fit. Try Service Watch to Optimize Endpoint Experience.
The rules of the game for IT have changed and you should believe us by now. However, we are not suggesting that you completely abandon your planned device refresh activities. Instead, provision hardware devices according to your internal policies because users need modern machines with additional computing power.
But using Service Watch Desktop solution for quick repairs and proactive support has its advantages. You save time, reduce costs, and increase the visibility of resource consumption for all of your endpoint devices. Bring IT and business together for a holistic end-user computing approach in a hybrid digital workplace.
Service Watch Desktop for Complete Digital Experience Monitoring starts at $4 per month per desktop.
Request a demo today and learn more.