Operations | Monitoring | ITSM | DevOps | Cloud
Monitoring
The latest News and Information on Monitoring for Websites, Applications, APIs, Infrastructure, and other technologies.
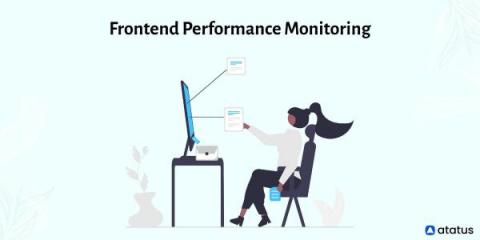
Frontend Performance Monitoring - Tools and How to Choose the Right One
Monitoring is as important as application development to keep an application running healthy for the best user experience. For this reason, a strong monitoring strategy is essential for your company's success, ensuring that metrics such as constant performance, high availability, and accessibility are never a concern. Many businesses neglect the importance of frontend monitoring for their applications.
Prometheus network monitoring: a new open source generation
Prometheus seeks to be a new generation within open source monitoring tools. A different approach with no legacies from the past. For years, many monitoring tools have been linked to Nagios for its architecture and philosophy or directly for being a complete fork (CheckMk, Centreon, OpsView, Icinga, Naemon, Shinken, Vigilo NMS, NetXMS, OP5 and others). Prometheus software, however, is true to the “Open” spirit: if you want to use it, you will have to put together several different parts.
Is the Cloud an Experience or a Destination?
In a recent episode of the Cloud Happens podcast, Archana Venkatraman, Associate Research Director in Cloud Data Management at IDC Europe talks about how the cloud isn’t a destination. It’s a continuum; a journey. In this blog, we explore that idea a bit more and dive into what really encapsulates a cloud experience. How can modern enterprises benefit from their cloud journey to solve the most gnarly data challenges to unlock innovation, enhance security, and drive resilience.
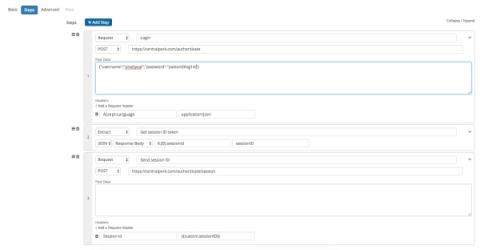
API & HTTP Headers: How to Use Request Headers in API Checks
In previous posts we covered why it’s important to monitor APIs and how to monitor and validate data from APIs. In this post we’ll focus on a simple but key feature that helps Splunk Synthetic Monitoring users create robust checks for availability, response time, and multi-step processes: Request Headers
SAP HotNews Setup with Notifications to Slack
Dashboard Fridays: Sample Salesforce dashboard
Visibility Anywhere: Key Takeaways from the NetOps Virtual Summit
What do big mountain ascents and modern network operations have in common? You’ll only succeed when you’re learning from experience. This was one among many compelling takeaways that attendees took from our recent NetOps Summit. Centered on the theme “visibility anywhere,” this event featured a number of compelling presentations, including a keynote from Jimmy Chin, the professional climber, photographer, and Academy Award-winning filmmaker.


