Operations | Monitoring | ITSM | DevOps | Cloud

The latest News and Information on Monitoring for Websites, Applications, APIs, Infrastructure, and other technologies.

Sponsored Post

How to Monitor ALL of Microsoft 365

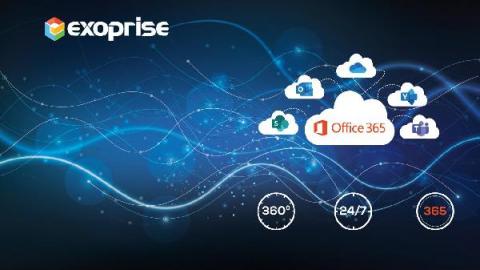
Only Exoprise provides full coverage for synthetic monitoring of the entire Microsoft 365 suite. The use of 8-10 different synthetic sensors per site provides customers and prospects with an ideal start. These site locations may include corporate headquarters, branch offices, or work from home settings with knowledge workers. Exoprise effectively monitors the health, availability, and performance of applications such as Azure AD, Exchange Online, Teams, Yammer, OneDrive, Outlook, Portal, etc. via synthetic sensors and captures real-time metric data in CloudReady.
How to Use Event Triggers For Windows Server Monitoring

Windows event logs and event triggers are an important part of Windows server monitoring. With the addition Event Viewer feature, Windows made it possible for server administrators to create custom tasks for certain events. This would be the so-called event trigger, and it could be a script or an email notification. This feature is highly important in terms of security and proactively dealing with issues with the server.

Track Digital Transformation Progress with Real-Time Data

According to a McKinsey study, 70 percent of digital transformation projects fail. It’s quite a paradox because the transformation is happening for growth and success. If this stat alone is anything to go by, it indicates that enterprises need to rethink their strategy and management of such transformations. So how are those other 30 percent of enterprises succeeding with their digital overhauls? Well, data and analytics play a vital role in helping track the progress of the process.

Why Are SaaS Observability Tools So Far Behind?

Salesforce was the first of many SaaS-based companies to succeed and see massive growth. Since they first started out in 1999, Software-as-a-Service (SaaS) tools have taken the IT sector and, well the world, by storm. For one, they mitigate bloatware by moving applications from the client’s computer to the cloud. Plus, the sheer ease of use brought by cloud-based, plug-and-play software solutions has transformed all sorts of sectors.

Dotcom-Monitor Device Manager

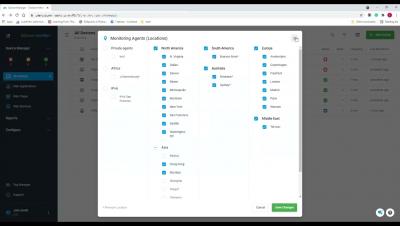
Learn more about managing your monitoring devices with the Device Manager within the Dotcom-Monitor platform. View specific devices details, like the number and current status of each device, monitoring frequency, and the timestamp the device was last monitored. You can also carry out several actions, such as enabling, postponing, and silencing a device, as well as cloning a device or task, deleting a device or task, and running a status report or an SLA report.

Planning Center: Simplifying observability and reducing MTTR in a serverless world, with Datadog

Justin Bodeutsch, Systems Administrator at Planning Center discusses how Datadog’s alerting, log management, serverless, and infrastructure monitoring tools have simplified internal processes and been instrumental in minimizing MTTR across the business.

Monitor and alert on essential RabbitMQ cluster metrics with the new Grafana Cloud integration

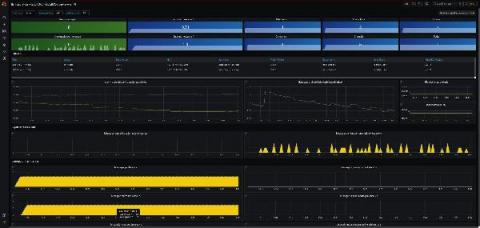
We are happy to announce that the RabbitMQ integration is available for Grafana Cloud, our composable observability platform bringing together metrics, logs, and traces with Grafana. RabbitMQ is one of the most popular open source message brokers, used worldwide at both small startups and large enterprises. It is easy to deploy on premises and in the cloud, and supports multiple messaging protocols.