Operations | Monitoring | ITSM | DevOps | Cloud

The latest News and Information on Monitoring for Websites, Applications, APIs, Infrastructure, and other technologies.

Last Day of The Quarter - Smooth Sailing?

You’re 24 hours away from the next quarter. Have you achieved everything in this one that you wanted to? Got a last-minute deal you need to get over the line? That’s ok, your favorite customer is just a quick video call away from signing on the dotted line – that’ll help you hit your target. Be a real problem if the call kept dropping out though – especially if they asked to reschedule. Oh, no, suddenly, your Teams is acting up!

Best practices for end-to-end service ownership with Datadog Service Catalog

In order to grow your organization effectively, you need to ensure the scalability of your systems. In a broad, distributed architecture, critical processes like incident triage, security response, and large-scale configuration changes can be difficult to execute without a programmatically accessible registry of what’s running in production and who owns it.

Webinar Recap: Myths and Realities in Telemetry Data Handling

Telemetry data is growing exponentially, but the business value isn’t increasing at a similar pace. Getting the right telemetry data is hard, so I recently had a conversation with Matt Aslett, Director of Research at Ventana Research, now a part of ISG, about five myths and realities in telemetry data handling.

How shipping/third-party logistics companies reduce MTTR and increase uptime with the Grafana LGTM Stack

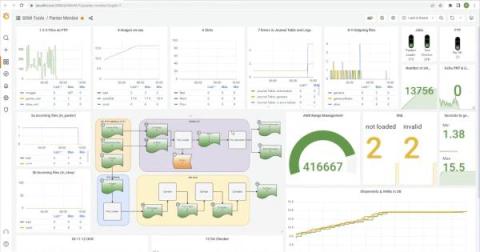
These days, everything can be tracked: transportation, deliveries, food orders. . . For consumers, knowing the location of a package or courier is a bonus, but for companies in the business of shipping, delivering, and third-party logistics, it’s a necessity. And so is having the right observability system to ensure everything gets where it needs to go. After all, errors, downtime, or anything that causes delays will end up delivering unhappy customers and lost revenue.

Major Improvements Coming for Linux Users

Linux®-based operating systems are becoming increasingly common among software developers. A whopping 45 percent were using Linux in 2022, according to Statista, which is not far behind Windows. Over the last months we have been focusing on improving the Tracealyzer experience for Linux users and the upcoming v4.9 release will bring major improvements.

Present-day IT Challenges Addressed by AIOps

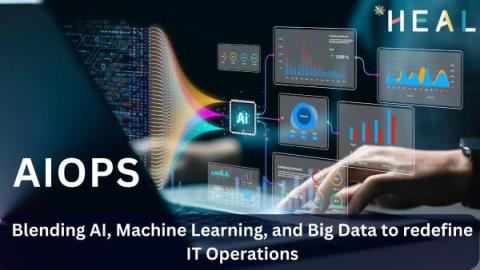
The increasing rise of Artificial Intelligence for IT Operations (AIOps) in information technology (IT) is rapidly emerging as a transforming force that will redefine the operational paradigms. Essentially, AIOps fuses machine learning, big data analytics, and various IT tools to automate and improve IT Operation processes, including event correlation, anomaly detection, and event causality.

Five improvements to Make Debugging Less Terrible

Over the past year, we released a couple of new offerings, like Session Replay and Cron Monitoring. But in addition to building new products, we’re constantly looking for ways to improve our core platform to help you debug software issues faster. As you hopefully saw during Sentry’s Launch Week, we shipped five quality-of-life improvements addressing the following problems: Here’s the latest.

Elevating Data Sovereignty with Stackify Self-Hosted Retrace

Stackify’s commitment to serving a broad array of industries is evident from its varied customer portfolio. From BigBank and Big Pharma to Logistics Supplier and Retail Bank, the Self-Hosted Retrace has proven adaptable and essential across different sectors. This versatility not only demonstrates the solution's robustness but also its capacity to meet your industry-specific demands, affirming Stackify's role as a critical tool in the optimization of IT infrastructures globally.

Deep Dive - Time Series Panel Visualizations: What Are They? How to Get Started? | Grafana

In this video, Grafana Developer Advocate Leandro Melendez describes Time series visualizations, the default and primary way to visualize time series data as a graph. They can render series as lines, points, or bars. They’re versatile enough to display almost any time-series data. — Found this video useful? Be sure to give it a thumbs up and subscribe to our channel for more helpful Grafana tutorial videos.