Operations | Monitoring | ITSM | DevOps | Cloud

Alerting: A Key Part of Application Performance Monitoring

In today’s digital world, users expect to have a seamless experience in their day-to-day applications. To achieve such reliability and stability in our application, information about the health and performance of an application has become necessary for developers to gain insights and fix bottlenecks to provide a seamless user experience. One of the best ways to gain such insights into an application is to use a monitoring system.

The Power of using Enterprise Alerts Remote Actions via Cloudbridge

For over 20 years Derdack has been developing products that meet the challenges of incident management. It is well documented how Enterprise Alert and SIGNL4 not only filter through the noise with advanced alert policies, but also target the right on-call engineer with the use of sophisticated scheduling, anywhere ad-hoc collaboration and 2way communication back to the originating event source.

Quick Bytes - Lumigo Alerts

Lumigo Alerts allows you to create customized alerts for anything lumigo monitors, including event-based alert (e.g., timeout) and key metrics (e.g., error rate). The alerts can delivered via email or a multiple of platform integration options like slack, Microsoft teams and more. Make sure to subscribe so you don't miss out on any new livestreams and observability content! With one-click distributed tracing, Lumigo lets developers effortlessly find and fix issues in serverless and containerized environments

MTTJ - What is Mean Time to Join (MTTJ)?

MTTJ – The time taken to join a meeting, and delays caused in ensuring right people are available, can be avoided using software automation and tools. This is not an often talked about topic, but am sure everyone is affected directly from this. We discuss this in detail here. What, why and how it can be avoided?

Static vs Dynamic Alert Thresholds for Monitoring

Every modern monitoring product will have some capabilities to leverage thresholds of some sort to automatically raise alerts when critical metrics pass a value that indicates something of concern may be occurring, such as a performance slowdown, resource constraint, or availability issue.

Alerting Techniques for an observable platform

Observable and secure platforms use three connected data sets: logs, metrics, and traces. Platforms can link these data to alerting systems to notify system administrators when an event requires intervention. There are nuances to setting up these alerts so the system is kept healthy and the system administrators are not chasing false positive alerts.

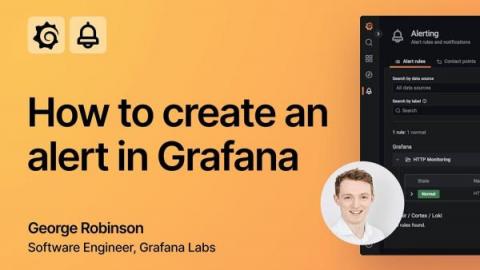
Grafana Alerting video: How to create alerts in Grafana 9

With the Grafana 9.0 release, we rolled out the new and improved Grafana Alerting experience, which is now the default alerting system across all of our products. Along with introducing significant improvements to Grafana Alerting based on community feedback and more robust alerting documentation to guide our users, we also created easy-to-follow video tutorials to help you get started with creating alerts.

Alerts Builder Demo | Setup powerful alerts on the go | SigNoz

In this video we walk you through the Alerts Builder feature that we have shipped with SigNoz in v0.10. Agenda: More about SigNoz: SigNoz - Monitor your applications and troubleshoot problems in your deployed applications, an open-source alternative to DataDog, New Relic, etc. Backed by Y Combinator. SigNoz helps developers monitor applications and troubleshoot problems in their deployed applications. SigNoz uses distributed tracing to gain visibility into your software stack.

Anodot Cloud Cost Management

Anodot's cloud cost management solution enables you to visualize costs in a single screen — across AWS, Azure, GCP and Kubernetes. Anodot leverages proprietary ML-based algorithms to offer root-cause analysis and recommended remediation. With continuous monitoring and deep visibility, you gain the power to align FinOps, DevOps, and Finance teams and cut your cloud bill.