Exploring the New Trace Explorer Page - SigNoz
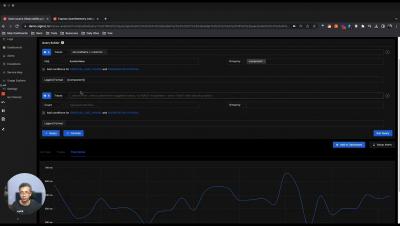
We recently shipped a new Trace Explorer Page. It will give users much more granular control over their trace data.


The latest News and Information on Monitoring for Websites, Applications, APIs, Infrastructure, and other technologies.
Elastic Search 8.9 introduces hybrid search with Reciprocal Rank Fusion (RRF) to combine vector, keyword, and semantic techniques for better results. This release also brings performance improvements in vector search and ingestion with response times that are up to 30%+ faster. Users also have more ingestion options with the new SharePoint Online connector, which includes document-level security.
As businesses embrace more cloud-native technologies and IT infrastructure becomes more dispersed, they must connect their business goals and end-user experience with the availability and performance of their IT infrastructure. This change necessitates infrastructure monitoring to assure compatibility with cloud environments, operating systems, storage, servers, virtualized systems, and other components.
Kubernetes has emerged as the de facto standard for container orchestration, with its ability to automate deployment, scaling, and management of containerized applications. However, even with the best practices and expertise, Kubernetes deployment can sometimes be a complex and challenging process. It involves multiple layers of infrastructure, including the application, Kubernetes cluster, nodes, network, and storage, and each layer can have its own set of issues and challenges.
Interest in generative AI and large language models (LLMs) has exploded in popularity thanks to a slew of announcements and product releases, such as Stable Diffusion, Midjourney, OpenAI’s DALL-E, and ChatGPT. The arrival of ChatGPT in particular was a bellwether moment, especially for developers. For the first time, an LLM was readily available and good enough that even non-technical people could use it to generate prose, re-write emails, and generate code in seconds.
I’m thrilled to announce that Gartner added Monitoring as Code (MaC) as an emerging practice into their Hype Cycles for Monitoring and Observability and Site Reliability Engineering. We are extremely hyped about this recognition and being listed as a vendor innovating in that space. Since we founded Checkly, our vision has been that monitoring should be set up as code and live in your repository; it must be open-source based and feel natural for developers.