Operations | Monitoring | ITSM | DevOps | Cloud
Monitoring
The latest News and Information on Monitoring for Websites, Applications, APIs, Infrastructure, and other technologies.
Structured logging best practices
The First 48 Hours of Ransomware Incident Response
Top tips: AI fatigue is a thing-navigating through AI challenges
Top tips is a weekly column where we highlight what’s trending in the tech world today and list out ways to explore these trends. This week we take a look at the effect of AI-related over-saturation and show you four ways to work around it.
Leveraging Git for Cribl Stream Config: A Backup and Tracking Solution
Having your Cribl Stream instance connected to a remote git repo is a great way to have a backup of the cribl config. It also allows for easy tracking and viewing of all Cribl Stream config changes for improved accountability and auditing. Our Goal: Get Cribl configured with a remote Git repo and also configured with git signed commits. Git signed commits are a way of using cryptography to digitally add a signature to git commits.
3 Ways to Lower Costs and Improve Efficiency This Year and Every Year
The second half of 2023 is officially in full swing, and with that comes everyone’s favorite topic of conversation; end of year fiscal targets and annual budget reviews. For IT teams, the perennial ask will come down from above…. “we need to find $X, what can we cut, where can we find efficiencies and how much can your department save?”. You need to figure out how to save money and improve efficiency – and you don’t have much time to do it.
Google and Goliath - An Ideal Match
The rise of ChromeOS has been a significant development in the world of technology, particularly in the enterprise world. As an IT professional, I have witnessed firsthand how businesses have shifted their approach towards technology to boost productivity and efficiency. ChromeOS has emerged as a cloud-based operating system that is gaining popularity due to its simplicity, affordability, and security features.
New in Grafana 10: Grafana Scenes for building dynamic dashboarding experiences
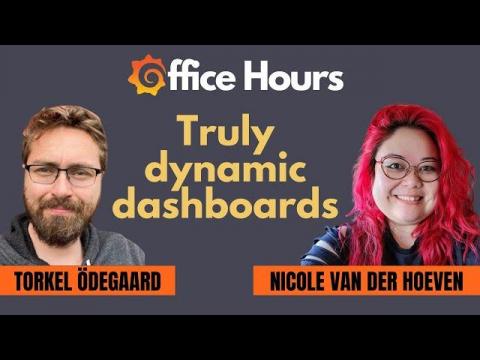
With Grafana 10, the latest major release of our data visualization platform, we wanted to explore new ways to empower our developer community. Case in point: Grafana Scenes, a new frontend library that enables developers to create dashboard-like experiences — such as querying and transformations, dynamic panel rendering, and time ranges — directly within their Grafana application plugins.
7 OpenTelemetry Metrics to Track for Better Visibility
In today’s rapidly evolving software landscape, ensuring observability is crucial for building robust and reliable applications. One of the critical components of observability is metrics, which provide valuable insights into the performance and behavior of our systems. OpenTelemetry, an open-source observability framework, offers a standardized approach to capturing, exporting, and analyzing metrics. This blog post explores seven OpenTelemetry metrics for tracking better visibility.
Revolutionizing call center management: The power of Full-Stack Observability with UCCE/PCCE
Full-stack observability with Cisco AppDynamics revolutionizes call center management, optimizing performance, improving customer experience and driving business success. Full-stack observability has revolutionized call center management by integrating Cisco AppDynamics into Cisco Unified Contact Center Enterprise (UCCE). Let’s explore the value of UCCE monitoring and its ability to deliver exceptional customer experiences.


