Operations | Monitoring | ITSM | DevOps | Cloud
Monitoring
The latest News and Information on Monitoring for Websites, Applications, APIs, Infrastructure, and other technologies.
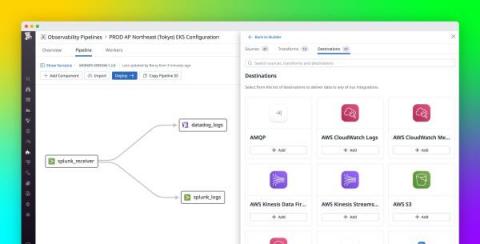
Send your logs to multiple destinations with Datadog's managed Log Pipelines and Observability Pipelines
As your infrastructure and applications scale, so does the volume of your observability data. Managing a growing suite of tooling while balancing the need to mitigate costs, avoid vendor lock-in, and maintain data quality across an organization is becoming increasingly complex. With a variety of installed agents, log forwarders, and storage tools, the mechanisms you use to collect, transform, and route data should be able to evolve and adjust to your growth and meet the unique needs of your team.
Automatic log level detection reduces your cognitive load to identify anomalies at 3 am
Integration roundup: Monitoring your AI stack
Integrating AI, including large language models (LLMs), into your applications enables you to build powerful tools for data analysis, intelligent search, and text and image generation. There are a number of tools you can use to leverage AI and scale it according to your business needs, with specialized technologies such as vector databases, development platforms, and discrete GPUs being necessary to run many models. As a result, optimizing your system for AI often leads to upgrading your entire stack.
Using UX and Observability to Track Application Health
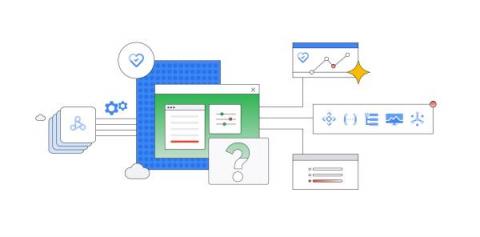
Introducing Personalized Service Health: Upleveling incident response communications
Personalized Service Health sends custom granular alerts about Google Cloud service disruptions, and integrates with incident management tooling.
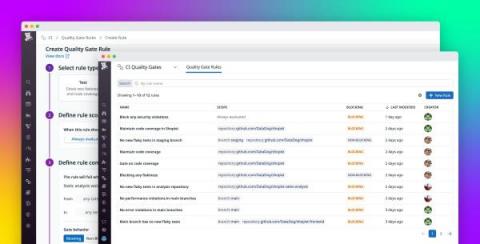
Enhance code reliability with Datadog Quality Gates
Maintaining the quality of your code becomes increasingly difficult as your organization grows. Engineering teams need to release code quickly while still finding a way to enforce best practices, catch security vulnerabilities, and prevent flaky tests. To address this challenge, Datadog is pleased to introduce Quality Gates, a feature that automatically halts code merges when they fail to satisfy your configured quality checks.
Have you transitioned to GA4 Yet?
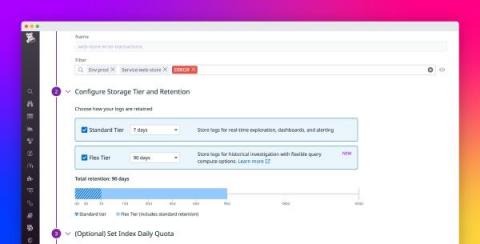
Store and analyze high-volume logs efficiently with Flex Logs
The volume of logs that organizations collect from all over their systems is growing exponentially. Sources range from distributed infrastructure to data pipelines and APIs, and different types of logs demand different treatment. As a result, logs have become increasingly difficult to manage. Organizations must reconcile conflicting needs for long-term retention, rapid access, and cost-effective storage.


