Operations | Monitoring | ITSM | DevOps | Cloud
Monitoring
The latest News and Information on Monitoring for Websites, Applications, APIs, Infrastructure, and other technologies.
A Detailed Guide to Docker Secrets
This post was written by Talha Khalid, a full-stack developer and data scientist who loves to make the cold and hard topics exciting and easy to understand. No one has any doubt that microservices architecture has already proven to be efficient. However, implementing security, particularly in an immutable infrastructure context, has been quite the challenge.
Monitoring edge and fog computing devices
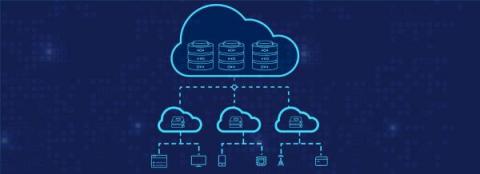
Edge computing and fog computing are technological advancements gaining traction in a hyper-connected world. Being close to the source, edge computing enables data collection and processing at the fastest possible speeds. Instead of sending all the data to a remote cloud location through the internet with latency, edge devices store and process most of it onsite and pass the heavy lifting to the central cloud to achieve the quickest turnaround.
What Is Digital Experience Monitoring: Benefits, Challenges & Best DEM Tools
Digital Experience Monitoring (DEM) is a practice that involves monitoring and analyzing the end-to-end digital experience of users interacting with websites, applications, and other digital services. By examining performance, availability, and usability from the end user’s perspective, DEM provides insights into the performance, availability, and usability of these services from the perspective of the end user.
SolarWinds announces its Next-Generation Build System aligns with NIST Secure Software Development Framework
How to Get Full-Stack Visibility for Your Java Applications - A Comprehensive Guide
Just a quick blog to let you know our new whitepaper “How to Get Full-Stack Visibility for Your Java Applications” is now available, download it here: How to Get Full-Stack Visibility for Your Java Applications | White Paper (eginnovations.com).
Troubleshooting a SaaS performance problem with Kentik
Discover how Kentik’s network observability platform aids in troubleshooting SaaS performance problems, offering a detailed view of packet loss, latency, jitter, DNS resolution time, and more. Phil Gervasi explains how to use Kentik’s synthetic testing and State of the Internet service to monitor popular SaaS providers like Microsoft 365.
Architecting Cloud Instrumentation
Architecting cloud instrumentation to secure a complex and diverse enterprise infrastructure is no small feat. Picture this: you have hundreds of virtual machines, some with specialized purposes and tailor-made configurations, thousands of containers with different images, a plethora of exposed endpoints, s3 buckets with both public and private access policies, backend databases that need to be accessed through secure internet gateways, etc.
Take back control of your Monitoring
What is Pushgateway?
Prometheus is an amazing tool, but it has limitations. Some of your applications, including batch jobs and ephemeral jobs, may not live long enough for it to find and scrape them. Since Prometheus cannot scrape all jobs, the company developed Pushgateway as a bridge tool. Because you usually cannot push metrics directly to the Prometheus application, you can sometimes use a Pushgateway to deliver the necessary data. When you need monitoring solutions, try Metricfire.


