Operations | Monitoring | ITSM | DevOps | Cloud

The latest News and Information on Monitoring for Websites, Applications, APIs, Infrastructure, and other technologies.

Tracing with the Grafana Cloud Agent and Grafana Tempo

Back in March, we introduced the Grafana Cloud Agent, a subset of Prometheus built for hosted metrics. It uses a lot of the same battle-tested code as Prometheus and can save 40 percent on memory usage. Ever since the launch, we’ve been adding features to the Agent. Now, there’s a clustering mechanism, additional Prometheus exporters, and support for Loki. Our latest feature: Grafana Tempo! It’s an easy-to-operate, high-scale, and cost-effective distributed tracing system.

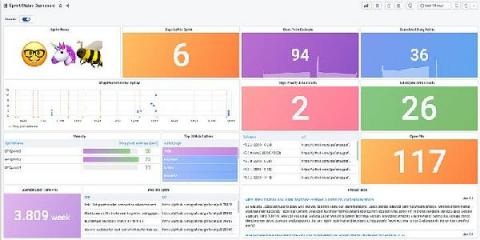
SquaredUp 5.0 is coming And it will be bigger and better than ever before!

As the year draws to a close, we’ve got exciting news. In the new year, we will be launching SquaredUp version 5.0! So, what exactly is in this big, bold update, you ask? Expect a gorgeous new look and feel plus major improvements to our two most popular features – Open Access and Dashboard Designer. We’re also bringing you even more visualizations for your Web API integrations, so you can display data in the best possible way in your single pane of glass. The best part?

The Limitations of Lighthouse

Google Lighthouse helps you identify page performance issues. It generates an overall performance “score” to make you feel good (or bad) about your site’s speed. This score can be useful, but has some limitations. Lighthouse is an automated tool for assessing web page quality. It generates metrics for performance, SEO, accessability and more. Google has been promoting it as THE way to measure website quality.

How to Monitor Kubernetes Applications

Software companies large and small are embracing microservices as a superior approach to application development and management, compared to the earlier monolithic model. These software teams tend to reach out for containerization as their preferred way of packaging and shipping applications. Containers provide a lightweight encapsulation of any application, whether it is a traditional monolith or a modular microservice.

Meet Continuous Code Improvement

If your experience as a developer is anything like mine, the best moments are those known as the "flow state.” When distractions drift into the background and all your energy is going in the creative direction of solving the problem at hand. Your brain is directly connected to your users through your code. Months of progress happen in hours. Unfortunately, those moments are rare. But it’s not emails or Slack messages that are the biggest distractions.

Introducing AI-Assisted Workflows and Automation-Grade Grouping

Imagine you’ve been working on a new feature for weeks. Finally—after exhaustive QA and testing, and more late coding sessions than you care to count—you release with a feeling of both accomplishment and relief. Only to be woken up at 3am that something’s wrong. Or worse, you get flooded with customer complaints that it’s not working properly. Well, it’s probably a scenario you don’t need to imagine. Every developer has a version of this story to tell.

Why SCOM needs SquaredUp: Performance monitoring reporting

As a SCOM admin, you’re probably heavily involved with alert analysis and performance monitoring. You probably also know then, that while SCOM is a great monitoring tool, it leaves a lot to be desired when it comes to reporting on performance monitoring. I’ve got good news for you. SquaredUp sits on top of SCOM and completely changes the game. How? Why? Read on for a comparison and break down of all the reasons you should do it with SquaredUp.