Operations | Monitoring | ITSM | DevOps | Cloud

The latest News and Information on Monitoring for Websites, Applications, APIs, Infrastructure, and other technologies.

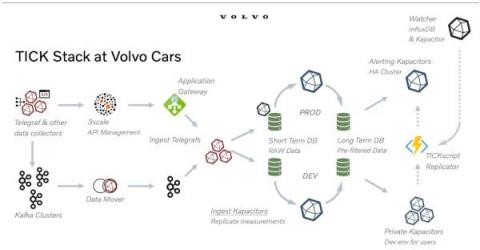
Volvo Uses InfluxDB to Evolve Its DevOps Monitoring to Enable Data-Driven Decisions

Production delays or stoppages are the bane of any manufacturer. When you’re a global automaker like Volvo, even the smallest delays can have significant ripple effects. But not even global leaders are immune to IT issues. This was the situation Volvo faced several years ago. It had a legacy DevOps monitoring solution in place for the previous 15–20 years, but that system no longer met the company’s needs. On the surface, it seems like a robust system.


In the need for speed, filmstrip and other powerful tools offer better transparency into website speed metrics

Talk about performance — and about how to make website content load faster — has increasingly been centered around optimizing web experiences leading to higher end-user engagement. More specifically, around metrics leading to website speed, greater conversions and ROI. Seeing what slows down your website and taking action will lead to better results overall.

How We Implemented a Zero-Error Policy Using Coralogix

With dozens of microservices running on multiple production regions, getting to a point where any error log can be immediately identified and resolved feels like a distant dream. As an observability company, we at Coralogix are pedantic when it comes to any issue in one of our environments. That’s why we are using an internal Coralogix account to monitor our development and production environments.

How Can Enterprise Organizations Reduce DevOps Tool Sprawl?

The world revolves around DevOps tools. DevOps engineers go insane when they have too many tools. The first statement is correct. Also, the second one. Tooling that helps in the automation of software development and infrastructure provisioning workflows and pipelines is critical for both the engineers who create the automations and the developers who use the automated workflows on a daily basis.

Learning from the AWS Outage: Internal Monitoring Alone Isn't Enough

If you have set up your own monitoring services with Amazon CloudWatch, Azure Monitor or another internal tool, we suggest you consider looking beyond the horizon. These services often provide internal web monitoring only. Perhaps they validate HTTP availability from locations outside their networks, but HTTP checks won’t give you a 360º view into the state of your services.

Virtual offsite ideas that work: How the Grafana Cloud team brings together 150 people online

It was a Wednesday in November, and we had just wrapped Grafana Labs' third virtual Grafana Cloud offsite of 2021. Outside my window, it was a dark and cold (8 degrees Celsius) night in Cologne (Köln), Germany. In Austin, Texas, it was early afternoon and headed for 80 degrees Fahrenheit. In Cape Town, South Africa, it was a windy and cool spring evening. And in Melbourne, Australia, our final speaker — who was up very early at 5 a.m. — was heading into a cool spring day.

How to Monitor Any SaaS Application Without Scripting Requirements

Exoprise lets IT administrators easily monitor any SaaS application (internal or external) without scripting. Collect performance data metrics (login time, upload and download time, network path performance, connect time, proxy connect time, DNS lookup time, TTFB, etc.) using our Web Login sensor. The sensor auto detects credential forms, supplies login credentials, and is able to record the server uptime and availability statistics in real-time. All this without the need for any complex scripting. It's simple to deploy the sensor. Start web application monitoring right away and improve the end-user digital experience.