Operations | Monitoring | ITSM | DevOps | Cloud

The latest News and Information on Monitoring for Websites, Applications, APIs, Infrastructure, and other technologies.

Compare and optimize your code with Datadog Profile Comparison

Code profilers offer detailed insight into the efficiency of application code by measuring things like the execution time and resource utilization of a service. Datadog’s always-on, low overhead Continuous Profiler provides snapshots of code performance for a service that are tagged with key metadata (e.g., region, service, release), so you can easily identify and optimize inefficient code.

AWS X-Ray vs Jaeger - key features, differences and alternatives

Both AWS X-Ray and Jaeger are distributed tracing tools used for performance monitoring in a microservices architecture. Jaeger was originally built by teams at Uber and then open-sourced in 2015. On the other hand, AWS X-Ray is a distributed tracing tool provided by AWS specifically focused on distributed tracing for applications using Amazon Cloud Services. Jaeger is a popular open-source tool that graduated as a project from Cloud Native Computing Foundation.

What's new in Grafana Cloud for September 2021: New panels, query caching, synthetic monitoring updates, and more

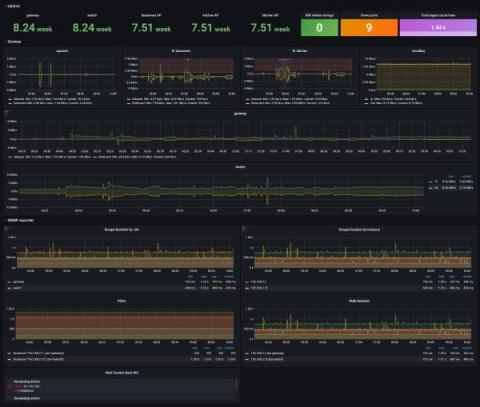
Here at Grafana, we’re constantly shipping new features to help our users get the most out of Grafana Cloud. Over the last few months, we’ve made it even easier to get started with out-of-the-box dashboards and new visualizations in Grafana Cloud. We also introduced capabilities like query caching, a “prettify JSON” option and commands for cortex-tools to make your data, dashboards, and queries more efficient.

Overprovisioned and Overspent: Optimize Before You Lift and Shift

Do you know what’s wrong with “lift and shift?” Everything. But why? In this video, SolarWinds Head Geek Leon Adato and Technical Content Manager for Community Kevin M. Sparenberg dig into what goes wrong during on-prem to cloud migration of applications and systems in many organizations and how monitoring can help not only avoid those problems but improve the overall outcome as well.

Logging Gitlab Runners for MacOS and Linux

Gitlab is the DevOps lifecycle tool of choice for most application developers. It was developed to offer continuous integration and deployment pipeline features on an open-source licensing model. GitLab Runner is an open-source application that is integrated within the GitLab CI/ CD pipeline to automate running jobs in the pipeline. It is written in GoLang, making it platform agnostic. It is installed onto any supported operating system, a locally hosted application environment, or within a container.

Open-Source Monitoring With SolarWinds AppOptics

In software terms, “open source” means applications and their source code are available for the public to download and modify free of cost. Anyone can access, edit, and supplement the code to create an enhanced version of the application. Vendors often do this by forking the source code to create their own version of the application, marketing their version commercially.

No more searching for a needle in a haystack: A world where Elastic & StackState team up

Meeting the goal of delivering great performance and reliability in the face of our ever-changing, increasingly autonomous IT environments is fundamentally challenged by a data problem. Sure, there’s lots of it - logs, metrics, and APM traces - but it is exceedingly hard to extract actionable information when there are so many fast moving parts.