The latest News and Information on Monitoring for Websites, Applications, APIs, Infrastructure, and other technologies.
The final stage of the popular Software Development Lifecycle after planning, analysis, design, and implementation is maintenance. This is where a full-fledged application running in production is constantly looked after and taken care of. Bugs, bottlenecks, slow database queries, security loopholes, and other issues are discovered and fixed before deploying the updated code. Log records and Application Performance Monitoring (APM) tools play a crucial role in software development maintenance.
For most of my career I’ve worked with health and wellness startups. Most of these companies have a wearable that tracks movement, heart rate, body weight or stimulates a body part. The common denominator between these apps is their use of sensor data to determine physiological progress an athlete is making. Problem is, your Bluetooth Low Energy (BLE) device does not have an internet connection and cannot send diagnostics anywhere if there are errors.
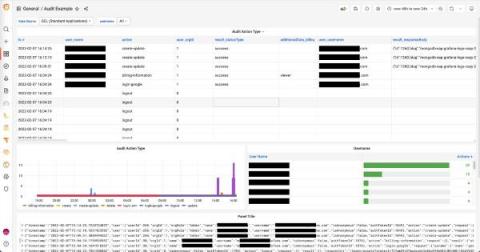
One of Grafana’s most powerful features is the ability to funnel data from hundreds of different data sources (i.e., services or databases) into a single dashboard without migrating the data from where it lives. You can connect and correlate data from Grafana’s curated observability stack for metrics, logs, and traces, or third-party services, such as Splunk, Elasticsearch, Github, Jira, and many more.
Welcome to the second iteration of What’s New in Sysdig in 2022! Before starting, once again, we wish you a happy Spring Festival, Seol-Nal, Tet Nguyen Dan, Tsagaan Sar, and Lailat al Miraj.
2021 saw some of the biggest websites on the internet experience outages that rippled across the globe. If you thought that “large” companies couldn’t experience website downtime, unfortunately, you were wrong. Website downtime can happen to any website, small, medium, or large, and it can happen when you least expect it. Thinking that the proof is in the pudding? Check out the most shocking websites that went down in 2021.
Prometheus is one of the leading open-source monitoring frameworks around today. It is well known for its operational simplicity, and for being highly available by default. It is the second project hosted by the Cloud Native Computing Foundation (CNFC) and was accepted into the programme on May 9, 2016. Prometheus is completely based on time series data collection and uses both a dimensional data model and flexible query language (PromQL).
Three funny facts that you may not have known: 1) Elvis Presley and Johnny Cash were colleagues. 2) Jean-Claude Van Damme was Chuck Norris’s security staff. 3) Pandora FMS has a plugin for WordPress. That’s right! Pandora FMS has a monitoring plugin for WordPress that has been totally renewed and prepared for you! Get to know Pandora FMS WP!