Operations | Monitoring | ITSM | DevOps | Cloud

Monitoring

The latest News and Information on Monitoring for Websites, Applications, APIs, Infrastructure, and other technologies.

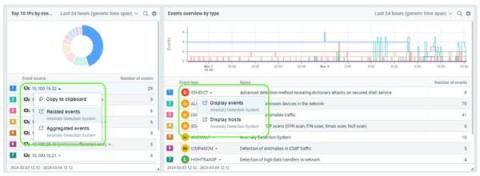
What's New in Progress Flowmon ADS 12.3?

IT professionals seek out solutions that provide in-depth visibility into their networks and streamline processes so they can more efficiently catch anomalies. A recent update to Progress Flowmon Anomaly Detection System (ADS) will address these concerns our customers have. This blog gives you the first look into how Flowmon ADS 12.3 improves your organization’s threat analyses and cybersecurity strategies.

Square Pegs, Round Holes: The Challenge of Integrating MELT Data into Traditional Data Warehouses

This is the first in a series of blog posts about the disconnect between modern IT and security teams and the vendors they’re forced to work with. If you’re looking for the second and third posts, you can find them here and here. Imagine this scenario: You’re grappling with the ever-escalating costs of your legacy solutions. What’s the logical next step? For many, it’s exploring the new wave of tools emerging, such as data warehouses.

Cribl Collaborates with Microsoft: Empowering Enterprises to Strengthen their Security Operations

As the cybersecurity landscape becomes more and more complex. It seems like we hear about a major breach of a different company every day. Enterprises are looking for robust solutions to help them manage the surge in data and security incidents. That’s why our recent collaboration announcement with Microsoft means so much to us. It’s not just a piece of paper; it’s a testament to our dedication to providing customers with the best tools and solutions for the job.

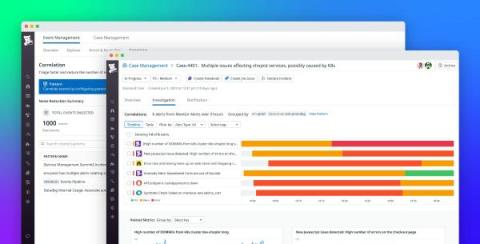
Aggregate, correlate, and act on alerts faster with AIOps-powered Event Management

Maintaining service availability is a challenge in today’s complex cloud environments. When a critical incident arises, the underlying cause can be buried in a sea of alerts from interconnected services and applications. Central operations teams often face an overload of disparate alerts, causing confusion, delayed incident response, alert fatigue, and redundant resolution efforts. These issues can negatively impact revenue and customer experience, especially during an outage.

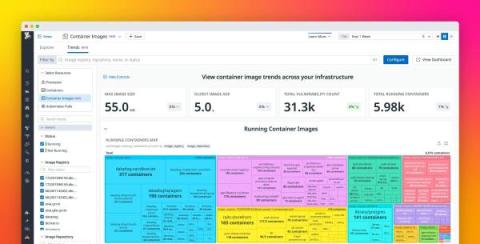
Track changes in your containerized infrastructure with Container Image Trends

Datadog’s Container Images view provides key insights into every container image used in your environment, helping you quickly detect and remediate security and performance problems that can affect multiple containers in your distributed system. In addition to having a snapshot of the performance of your container fleet, it’s also critical to understand large-scale trends in security posture and resource utilization over time.

Managing High Volume with OpenTelemetry

As your systems grow, so do the challenges of managing high-volume telemetry data. From horizontal scalability strategies to efficient data aggregation and storage techniques, we'll cover everything you need to know to keep pace with your expanding infrastructure. Don't let scalability constraints hinder your observability efforts—learn how OpenTelemetry can empower you to manage high volumes of telemetry data effectively and efficiently.

Summary Report: Mastering Cloud Cost Optimization in 2024

We’re back with this year’s cloud cost report. This time around, we’re mixing things up a bit. Don’t worry. You’ll still get an in-depth look at cloud cost in the FinOps industry, but you’ll get more insights with our data-driven results from leading reports and Anodot’s customers. If you’re already reaching out to grab that report, you can find it here.

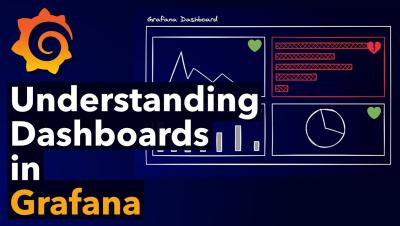
Understanding Dashboards in Grafana | Panels, Visualizations, Queries, and Transformations

Gain a fundamental understanding of what Dashboards are in Grafana and how they can be used to visualise your data to ensure your systems remain healthy and operational. We'll cover the must know concepts, including panels, visualizations, queries, and transformations, that will ensure you have all the tools you need to build awesome dashboards in Grafana. Chapters: ☁️ Grafana Cloud is the easiest way to get started with Grafana dashboards, metrics, logs, and traces. Our forever-free tier includes access to 10k metrics, 50GB logs, 50GB traces and more. We also have plans for every use case.