Operations | Monitoring | ITSM | DevOps | Cloud

Monitoring

The latest News and Information on Monitoring for Websites, Applications, APIs, Infrastructure, and other technologies.

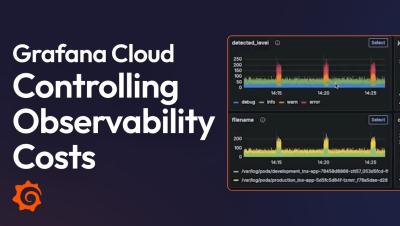
How to Control Observability Costs with Grafana Cloud | Demo | Adaptive Telemetry | Loki | Profiling

In this video, Grafana Labs demonstrates how Grafana Cloud addresses the challenges of rising observability costs faced by organizations worldwide. As observability costs grow and logging architectures become increasingly resource-intensive, teams are forced to make difficult decisions about coverage, often leaving critical blind spots. Grafana Cloud offers a cost-effective, end-to-end observability solution that eliminates the need for compromise on efficiency or performance.

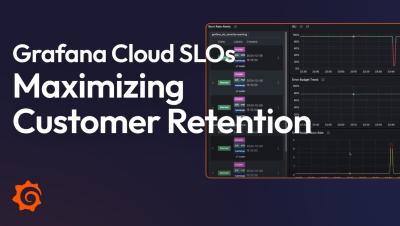
How to Maximize Customer Retention with Grafana Cloud SLOs | Demo | Alert Management | Incidents

In this video, Mark Covelo, a Solutions Engineer at Grafana Labs, demonstrates how Grafana Cloud SLO empowers organizations to improve customer retention by simplifying the adoption of Service Level Objectives (SLOs). SLOs provide critical insights into the customer experience, enabling teams to prioritize and resolve user-impacting issues effectively.

How MSPs Can Leverage AI to Increase Efficiencies and Increase Margins

The Managed Service Provider (MSP) industry is highly competitive. The growing demand for IT management and support has led to a proliferation of MSPs, ranging from small to established providers. This saturation intensifies pressure on profit margins and heightens expectations for delivering faster, more efficient services. With many MSPs competing for business, companies must find ways to differentiate themselves to attract and retain clients. At ScienceLogic, we know that AI holds the key to success.

12 Days of Christmas Updates | RECAP

Day 1 We've added a filter called “host” to Real User Monitoring that separates events by URL, letting you compare performance and user experience across your websites. Day 2 Now you can delete all source maps from previous builds with a single API call. Day 3 Our Azure DevOps integration now supports multiple projects, so you can keep your source code and work items in different projects!

Cribl Stream: Up To 47x More Efficient vs OpenTelemetry Collector

Let me set the record straight before anyone accuses me of bias or not being an OpenTelemetry supporter. Cribl loves OpenTelemetry! We’ve written lots of blogs about It; we have vendor-specific OpenTelemetry Destinations (with more to come!), and we support automatic batch parsing for easier data manipulation and re-batching for network transport efficiency of logs, metrics, and traces.

5 Types of Network Topology and How to Choose the Right One

Successful businesses operate like well-oiled machines. Maintaining an effective network is the key to achieving this smooth operation. After all, the right network delivers efficiency and scalability and protects against cybersecurity threats. That said, building a network that meets your unique business needs can be challenging. To do so, you need to pick the correct type of network topography. But what is network topography, and what options are out there? Let's dive in.

Capacity Management: Debugging Exceeded Rate Limits

Snuba, the primary storage and query service for event data that powers Sentry in production, has historically been doing rate limiting under the hood, making it hard to discover and increasing time to resolve customer support requests. This is not something you’d know the specifics of unless you were deep in the Snuba code. But as we triage support questions from customers, one issue tends to pop up: RateLimitExceeded. You got tired of not getting query results.

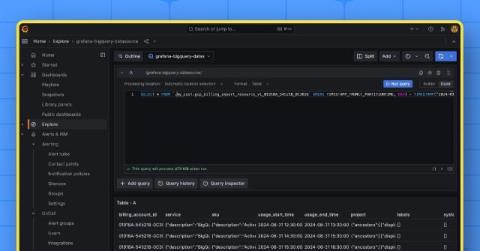
How to securely connect Grafana to Google BigQuery using Workload Identity Federation

Umesh Pawar is a Senior Cloud Engineer at Searce, and is also the co-organizer of the Grafana and Friends Delhi Group. Umesh has been focused on infrastructure and app modernization, as well as observability solutions including the Grafana LGTM Stack, for the past two years. With the Google BigQuery data source plugin for Grafana, you can easily query and visualize data from BigQuery directly in Grafana.