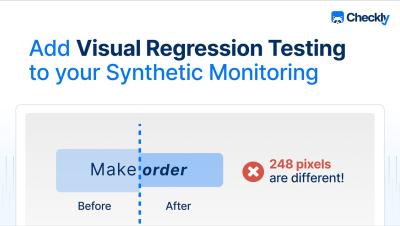
Add Visual Regression Testing to your Synthetic Monitoring
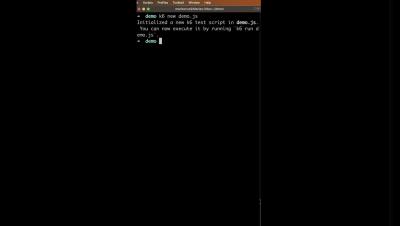
Checkly now supports Visual Regression Testing (VRT) with Playwright's `toHaveScreenshot` method. Add a single assertion to your browser checks and include VRT in your sites' and apps' global monitoring.