Operations | Monitoring | ITSM | DevOps | Cloud

The latest News and Information on Monitoring for Websites, Applications, APIs, Infrastructure, and other technologies.

Guide to Monitoring Your Apache Zipkin Environment Using Telegraf

Using Apache Zipkin is important because it provides detailed, end-to-end tracing of requests across distributed systems, helping to identify latency issues and performance bottlenecks. Monitoring your Zipkin environment is crucial to ensure the reliability and performance of your tracing system, allowing you to quickly detect and address any anomalies or downtime.

Kentik Close-Up 01. PeeringDB

Welcome to the debut episode of Kentik Close-Up! Join Leon Adato and special guests Greg Villain and Lauren Basile as they dive deep into PeeringDB, the essential public address book for network interconnection. Discover how Kentik integrates PeeringDB to enhance network performance, reduce costs, and optimize connectivity. Learn the ins and outs of peering strategies, and see how Kentik's innovative solutions simplify complex network management tasks. Don’t miss this informative first episode of Kentik Close-Up!

Bridging the gap: Integrating network and application monitoring for complete visibility

As technology progresses and applications become more intertwined, sticking to the old ways of monitoring networks separately just doesn’t cut it anymore. Network and application teams often work in silos, using different tools and focusing on different goals. This split approach frequently leaves both sides with a piecemeal understanding of issues, making it challenging to pinpoint and fix problems that span both areas.

Independent, Involved, Informed, and Informative: The Characteristics of a CoPE

As our Field CTO Liz Fong-Jones says, production excellence is important for cloud-native software organizations because it ensures a safe, reliable, and sustainable system for an organization’s customers and employees. A CoPE helps organizations cultivate the practices and tools necessary to achieve that consistently. In part one of our CoPE series, we analogized the CoPE with safety departments.

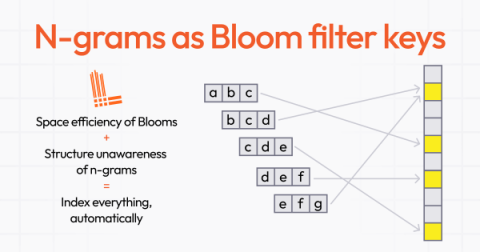
Grafana Loki query acceleration: How we sped up queries without adding resources

As we discussed when we rolled out the latest major release of Grafana Loki, we’ve grown the log aggregation system over the past five years by balancing feature development with supporting users at scale. A big part of the latter has been making queries much faster — and that was a major focus with Loki 3.0 too. We’ve seen peak query throughput grow from 10 GB/s in our Loki 1.0 days to greater than 1 TB/s even before 3.0.

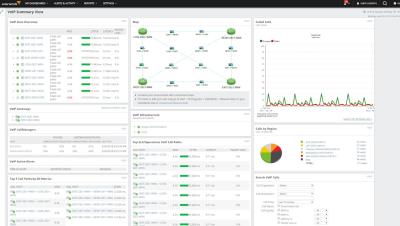
VoIP and WAN Performance Monitoring and Troubleshooting with VoIP & Network Quality Manager

Tired of end-user complaints about VoIP call quality? Learn how SolarWinds VoIP & Network Quality Manager monitors WAN performance of your remote sites by tracking key edge-to-edge router and VoIP call paths to ensure call quality using Cisco IP SLA technology that can be used standalone or integrated seamlessly with Network Performance Monitor. VoIP & Network Quality Manager correlates call detail records (CDRs) with Cisco IP SLA Operations, and delivers VoIP call statistics for VoIP troubleshooting through a highly intuitive web interface that offers point-and-click simplicity and easy access to call performance statistics.

Removing ad trackers and cookies - the technical perspective

Sentry recently completed a multi-month project to remove all non-essential cookies and trackers from our public websites. For more context, see two blog posts that offer differing perspectives on the project: one from our marketing team, another from our legal team, and a third blog post that explains our privacy values and our ultimate motivation.

Getting Started: Your Ruby On Rails App Hosted On DigitalOcean With AppSignal

Imagine this: you’ve just finished working on your brand new Rails app and have deployed it to a cloud provider like DigitalOcean. Like any developer, you’re very proud of your work but you still have lots of questions, like: Your goal is to provide the best user experience. You want to be notified whenever errors or other important events occur so you can take care of them fast. It would be great to have a setup that automatically monitors your application. Enter AppSignal!

Track Errors in Your Python Flask Application with AppSignal

In this article, we'll look at how to track errors in a Flask application using AppSignal. We'll first bootstrap a Flask project, and install and configure AppSignal. Then, we'll introduce some faulty code and demonstrate how to track and resolve errors using AppSignal's Errors dashboard. Let's get started!