Operations | Monitoring | ITSM | DevOps | Cloud

Monitoring

The latest News and Information on Monitoring for Websites, Applications, APIs, Infrastructure, and other technologies.

The new Check Overview is now live!

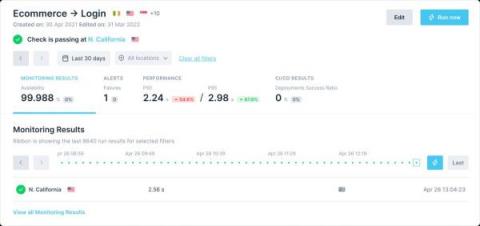
Today, I'm excited to share the release of a long-planned and requested feature - our new Check Overview Page. Until now, Checkly enabled you to troubleshoot single alerts, but a deep dive into the long-term performance trends was limited. That is not the case anymore. In the new Check Overview, we’re introducing the enhanced analytics in four distinct categories: The update is focused on two important outcomes.

ASP.NET Core 7 has built-in dark mode for error pages

You may remember Dark Screen of Death, the Chrome extension to bring dark mode to ASP.NET Core exception pages that we launched back in February. I probably should have followed the commits on the aspnetcore repository more closely, since it turns out that ASP.NET Core 7 comes with its own dark mode version of error pages. In this post, I'll share how to enable it and look at the differences between the built-in version and the Chrome extension.

Events in MS Windows and Pandora FMS, does anyone give more?

If the spreadsheet was the essential application for accounting and massification of personal computers, MS Windows® operating system was the graphical interface that turned work into something more pleasant and paved the way for web browsers for the Internet as we know it today. Today, in Pandora FMS blog, we discuss.

Set up and observe a Spring Boot application with Grafana Cloud, Prometheus, and OpenTelemetry

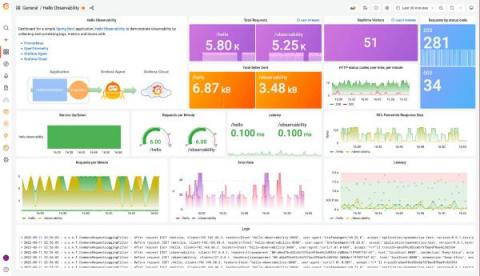
Spring Boot is a very popular microservice framework that significantly simplifies web application development by providing Java developers with a platform to get started with an auto-configurable, production-grade Spring application. In this blog, we will walk through detailed steps on how you can observe a Spring Boot application, by instrumenting it with Prometheus and OpenTelementry and by collecting and correlating logs, metrics, and traces from the application in Grafana Cloud.

NiCE Active 365 Management Pack 4.0 released

Microsoft 365 services help companies worldwide improve business and revenue by providing best in class digital workspace experience. The NiCE Active 365 Management Pack complements this by advanced M365 monitoring such as full Teams Call analysis integrated into Microsoft SCOM. Advanced monitoring and analytics help you reveal unwanted micro-events influencing the health and performance of the system and its users.

Synthetic Monitoring for CI/CD Pipelines

For DevOps teams, delivering quality software has long required reconciling a major tension: In a perfect world, you’d catch every issue in each new release of your application before you deployed the release into production. But in the real world, doing so is tricky, not least because it’s hard to collect data about application performance before the application is actually deployed.

On-Premises Application Monitoring: An Introduction

In the present age of cloud-native everything, it can be easy to forget that some applications still run on-premises. But they do and managing the performance of on-premises apps is just as important as monitoring those that run in the cloud. With that reality in mind, here’s a primer on how to approach on-premises application performance monitoring as part of a broader cloud-native performance optimization strategy.

Debugging the Java Message Service (JMS) API using Lightrun

The Java Message Service API (JMS) was developed by Sun Microsystems in the days of Java EE. The JMS API provides us with simple messaging abstractions including Message Producer, Message Consumer, etc. Messaging APIs let us place a message on a “queue” and consume messages placed into said queue. This is immensely useful for high throughput systems – instead of wasting user time by performing a slow operation in real-time, an enterprise application can send a message.