Operations | Monitoring | ITSM | DevOps | Cloud

Monitoring

The latest News and Information on Monitoring for Websites, Applications, APIs, Infrastructure, and other technologies.

6 lessons from Cloudflare's June 2022 outage

On June 21, 2022, the US-based global content delivery network (CDN) provider and security company Cloudflare suffered an outage at 6:27 UTC that lasted until 7:42. The outage was caused by a network configuration error that affected 19 of Cloudflare's data center locations — Amsterdam, Atlanta, Ashburn, Chicago, Frankfurt, London, Los Angeles, Madrid, Manchester, Miami, Milan, Mumbai, Newark, Osaka, São Paulo, San Jose, Singapore, Sydney, Tokyo.

StackState's v5.0 Release Delivers New 4T Monitors and More: Apply the Power of Topology to Transform Traditional IT Monitoring

This week we released v5.0 of StackState’s observability and AIOps platform, which introduces a rich set of new capabilities. Our latest release contains a little something for everyone responsible for reliably running business critical workloads in dynamic environments – SREs, DevOps, central platform teams, even business teams – and for new and existing users alike.

Improve Website Performance by Checking Logs

In the early days of log analysis, application developers would use their logging libraries to write logs to files stored on a disk. After years of relying on those libraries, they found that they were unable to monitor the performance of their applications anymore because they didn’t understand the way their logging libraries worked. This led to a shift from using log files stored on a disk to using Syslog.

Deconstructing AIOps: Is it even real?

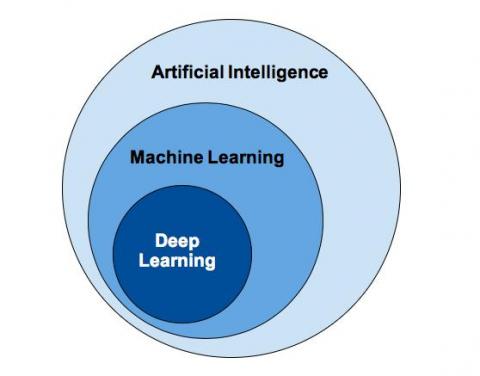
This essay explores AIOps and investigates if machine intelligence applies to IT operations (ITOps). I will dive into objection handling around artificial intelligence (AI) in pop culture and address the limitations around data sets and implicit bias coded into machines. Then, I will delve into what this means for ITOps and the ways AI-based parsing utilities can help operators and developers alike. How does Sumo Logic enable anomaly detection and identify threats?

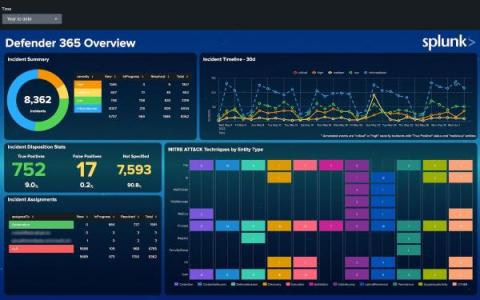
Dashboard Studio: Level-Up Your App with Dashboard Studio

Dashboards are a powerful tool for communicating a lot of information at once. Many Splunk apps are packaged with dashboards to help you make the most of your data. For example, the Microsoft 365 App for Splunk comes with a number of dashboards to provide insights around usage, incidents, and more.

Have fun again creating, discover visual console and dashboard editing

The visual console editor allows the user to visually design the final layout by dragging elements with the mouse, choosing the background and the icons that represent the status of each relevant aspect you want to show. With dashboards you may define screens with different created visual elements and share them with other users or display them in full screen as slides for the whole team to see.

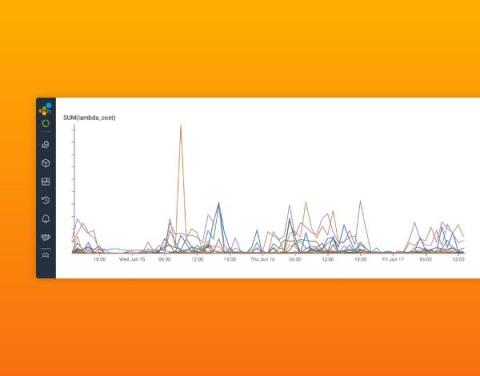
Exploring AWS Costs Beyond the Service Level

Honeycomb uses AWS Lambda as a core part of our query execution architecture; Lambda’s ability to quickly allocate lots of resources and charge us only for use is invaluable to keeping Honeycomb fast and affordable. Our total Lambda bill is easily accessible in the AWS Console, but how do we know which customers or application areas dominate this bill? How do we judge the cost of changes we make to our own software?

Financial Impact of an Outage

In October 2021, the world’s largest social media platform suffered a massive worldwide outage affecting billions of customers. Facebook has a monthly active user base of 2.8 billion users, which increases to 3.5 billion when you include its subsidiaries such as Instagram, WhatsApp, and Oculus. The platform succumbed to a “Gigalapse,” which happens when a server can’t adequately respond to excessive demand.