Operations | Monitoring | ITSM | DevOps | Cloud

Monitoring

The latest News and Information on Monitoring for Websites, Applications, APIs, Infrastructure, and other technologies.

How to Save on Monitoring Costs by Using Honeycomb

Are you overspending on monitoring and APM tools? Forrester’s Total Economic Impact analysis of Honeycomb identified significant ROI in customers using us to reduce spend on less efficient APM workflows. But this isn’t about budget reallocation to a newly branded set of similar but shinier tools.

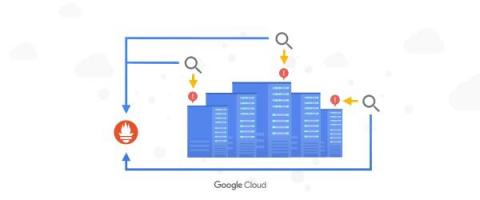
Cloud Monitoring metrics, now in Managed Service for Prometheus

According to a recent CNCF survey, 86% of the cloud native community reports that they use Prometheus for observability. As Prometheus becomes more of a standard, an increasing number of developers are becoming fluent in PromQL, Prometheus’ built-in query language. While it is a powerful, flexible, and expressive query language, PromQL is typically only able to query Prometheus time series data.

Open Source Single Pane of Glass Monitoring | SigNoz

Single pane of glass monitoring is a term used to denote monitoring applications with a single tool that provides a comprehensive set of dashboards for the entire software system of an organization. Managing multiple monitoring tools for different aspects of the IT system becomes too cumbersome. And that’s how the concept of a single pane of glass monitoring evolved. Most modern applications are now built using distributed software systems.

Application Snapshots: A Valuable Observability Signal for Developers

Monitoring is often not the first thing on the mind of the modern developer. Yet, it’s necessary at many points of the software development lifecycle, including: before deprecating an API, before launching a new feature, after launching the feature, and more. In fact, monitoring needs can vary much more than the classic Ops monitoring.

Authors' Cut-How Observability Differs from Traditional Monitoring

Remember the old days where if you had an uptime of 99.9 you could be fairly confident everyone was having a good experience with your application? That’s not really how it works anymore. Modern, distributed systems are so complex they typically fail unpredictably, making it much harder to diagnose issues. Traditional monitoring grew out of those early days, allowing you to check the health of simpler systems.

TL;DR Replication from Edge to Cloud with InfluxDB

Depending on your available resources, data analysis can take place at the edge or in the cloud, but businesses don’t need to choose one location over the other. There are benefits to giving the edge autonomy to collect, process, and act on data locally. Data replication helps maintain edge autonomy and makes it easier for users to get the data they need, where they need it.

Introducing Metric Alert notification charts and Duplicate Alerts

Unless you stare at Sentry all day waiting for error or performance problems to pop up, chances are you rely on alerts to let you know when something breaks or slows down. There are two types of alerts you can set up: 1) Issue Alerts, which are tied to issues that meet predefined criteria, and 2) Metric Alerts, which trigger when error volume or performance metrics like apdex, latency, or throughput surpass a pre-defined threshold.