Operations | Monitoring | ITSM | DevOps | Cloud

Monitoring

The latest News and Information on Monitoring for Websites, Applications, APIs, Infrastructure, and other technologies.

Move Faster with Rollbar Improve

Rollbar was founded with the belief that done is better than perfect. Building software is complex and it's better to move quickly and manage risk intelligently rather than try to build perfect code. For the past decade, Rollbar has provided peace of mind to hundreds of thousands of developers by monitoring production environments for errors. The tool has been leveraged to find and fix bugs in a fraction of the time and is trusted by the individual developers to at-scale enterprises.

How to Save on Monitoring Costs by Using Honeycomb

Are you overspending on monitoring and APM tools? Forrester’s Total Economic Impact analysis of Honeycomb identified significant ROI in customers using us to reduce spend on less efficient APM workflows. But this isn’t about budget reallocation to a newly branded set of similar but shinier tools.

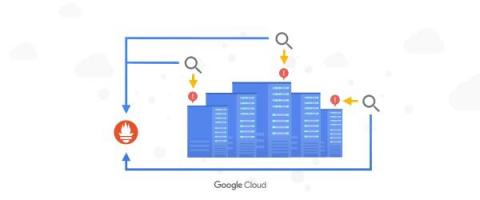
Cloud Monitoring metrics, now in Managed Service for Prometheus

According to a recent CNCF survey, 86% of the cloud native community reports that they use Prometheus for observability. As Prometheus becomes more of a standard, an increasing number of developers are becoming fluent in PromQL, Prometheus’ built-in query language. While it is a powerful, flexible, and expressive query language, PromQL is typically only able to query Prometheus time series data.

Open Source Single Pane of Glass Monitoring | SigNoz

Single pane of glass monitoring is a term used to denote monitoring applications with a single tool that provides a comprehensive set of dashboards for the entire software system of an organization. Managing multiple monitoring tools for different aspects of the IT system becomes too cumbersome. And that’s how the concept of a single pane of glass monitoring evolved. Most modern applications are now built using distributed software systems.

Application Snapshots: A Valuable Observability Signal for Developers

Monitoring is often not the first thing on the mind of the modern developer. Yet, it’s necessary at many points of the software development lifecycle, including: before deprecating an API, before launching a new feature, after launching the feature, and more. In fact, monitoring needs can vary much more than the classic Ops monitoring.

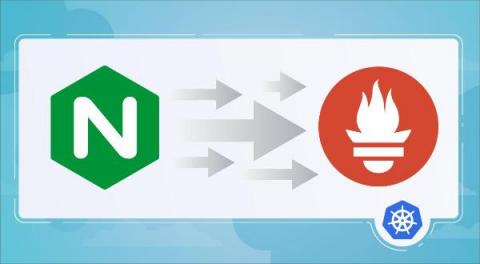
How to monitor nginx in Kubernetes with Prometheus

nginx is an open source web server often used as a reverse proxy, load balancer, and web cache. Designed for high loads of concurrent connections, it’s fast, versatile, reliable, and most importantly, very light on resources. In this article, you’ll learn how to monitor nginx in Kubernetes with Prometheus, and also how to troubleshoot different issues related to latency, saturation, etc.

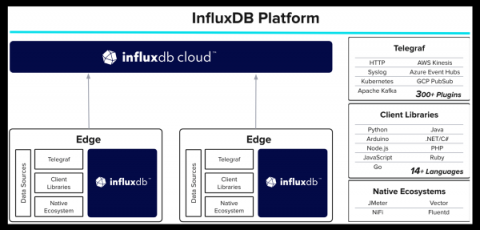
Monthly Product Update - Edge Data Replication and Sample Apps for IoT & Node.js

We love to write and ship code to help developers bring their ideas and projects to life. That’s why we’re constantly working on improving our product in sync with developer needs to ensure their happiness and accelerate time to awesome. This is the second in a blog series covering our product’s latest features — features that we think will save you time and effort when building with time series and InfluxDB.

InfluxDB Named a Leader in G2's Summer Grid Report for Time Series Databases

Industry-leading time series platform recognized for ease of setup and user satisfaction SAN FRANCISCO, June 30, 2022 – InfluxData, creator of the leading time series platform InfluxDB, today announced it has been named a leader in the G2 Grid for Time Series Databases, as well a leader within the inaugural Momentum Grid® Report for Time Series Databases in the Summer 2022 ratings from G2, the world’s leading business solution review platform.

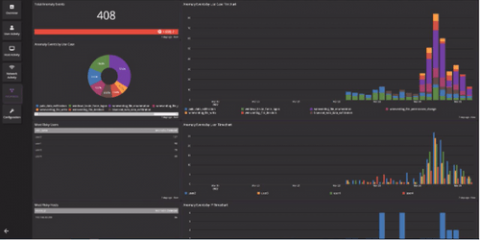
Centralized Log Management for Network Monitoring

It’s been a long few years for your IT department. In the span of one month, you had to make sure that all employees and contractors could work remotely. This meant giving everyone access to all cloud resources and ensuring uptime. Then, you needed to start securing access. Now, you need to shore up all your security as the phrase “zero trust architecture” has recently entered conversations with leadership.