Operations | Monitoring | ITSM | DevOps | Cloud

The latest News and Information on Monitoring for Websites, Applications, APIs, Infrastructure, and other technologies.

Why You Need Real User Monitoring to Really Understand Your Web Performance

Great Lighthouse scores, but your site is still slow. Sound familiar? You’ve run PageSpeed Insights, Request Metrics, and every other synthetic test you can find. Your scores look great. But your analytics shows users bouncing, conversions dropping, and complaints about “slow pages.” What’s going on? The answer is simple: synthetic testing only tells you how your site performs in a test, not how it performs for real users in the real world.
Sponsored Post

Smarter alerts using P75 for more signal and less noise

We've rolled out a new feature in Raygun Alerting that gives you more control over how you track and respond to performance regressions. Starting today, you can now use the 75th percentile (P75) as a filter option for page performance data in Real User Monitoring, such as Core Web Vitals and page load time, right alongside the default 'Average'. This option is available under the "Page/XHR performance change" condition and supports all the Web Vitals metrics we track: Let's break down why this matters, when you should use P75, and how it gives you better, faster insights into how real users are experiencing your site or app.

5 Tips for Managing Client Sites With Oh Dear

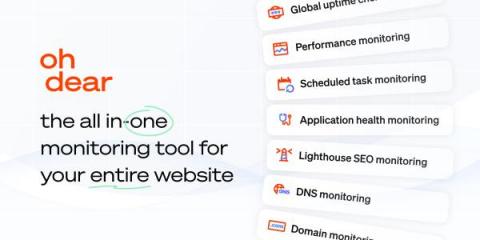
Managing dozens (or hundreds) of client sites can quickly become chaotic without the right tools. Whether you're running an agency, internal platform team or dev shop, visibility and control are everything. That's where Oh Dear comes in. Oh Dear is an all-in-one monitoring service that gives you a unified dashboard for uptime checks, performance monitoring, broken link detection, SSL and domain expiry alerts, scheduled task validation and more.

The 3 smart updates to our Jira plugin

The Jira plugin is one of our most-used integrations and for good reason. Teams rely on it daily to stay on top of work, manage issues, and ship on time. As more people leaned on it, we saw a chance to make the experience even smoother. So, we gave it an upgrade. We’ve refreshed the out-of-the-box dashboards, simplified the data streams, and improved the overall experience. So, let’s take a closer look at what’s changed.

Map, Transform, Filter: How Copilot Editor Helps Teams (and Their Pipelines) Have It All

Ever spent a week wrangling log pipelines just to get your SIEM to stop screaming about missing fields? Wasted way too much time stripping out noisy events and reformatting data for analytics? You’re not the only one. If you work in Security or ITOps, you know the pain: every new data source means another round of schema headaches, more manual mapping, endless field transformations, and a quick prayer that you didn’t break something critical (or let in a flood of junk events).

How to Log Into a Docker Container

When your Docker container isn't behaving the way you expect, you need to get inside and see what's going on. Maybe your app is throwing errors, a service won't start, or you just need to check some configuration files. Getting into a running Docker container is simpler than you might think, but there are several ways to do it depending on your situation. This guide shows you exactly how to log into Docker containers, troubleshoot common issues, and debug your applications effectively.