The latest News and Information on Monitoring for Websites, Applications, APIs, Infrastructure, and other technologies.
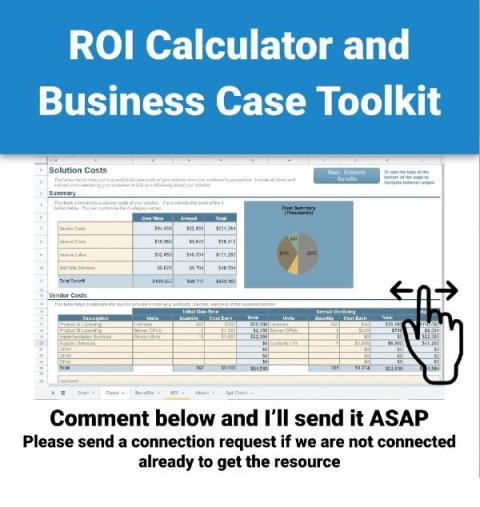
Calculating the true value of an IT project can be difficult, primarily due to the challenge of quantifying notions through dollar values. For example, automating processes will undoubtedly increase efficiency, but what’s the dollar value of such output?
If you manage a network, every network device generates a large volume of logs. These logs are extremely important and narrate a story about both events and the sequencing of those events within your network. This capability is critical for any network monitoring software, helping you easily understand network activities, user actions, security breaches, and much more.
Dependence on Microsoft 365 and Teams has never been greater, and the pressure is on for IT teams to deliver exceptional user experiences – anytime, anywhere. The modern workplace sees users connecting from the office, home, and pretty much any place in between. This hybrid work model has a significant impact on IT, the network and the overall quality of service perceived by the users.
In this article, we will explain what system performance metrics are and why you need to monitor them. Then we will look at Graphite and Grafana monitoring systems, which make it easy to collect, save and visualize metrics. Finally, we will consider why you should choose MetricFire to monitor your system’s metrics. If you would like to learn more about the benefits of MetricFire, book a demo with our experts or sign up for a free trial today.
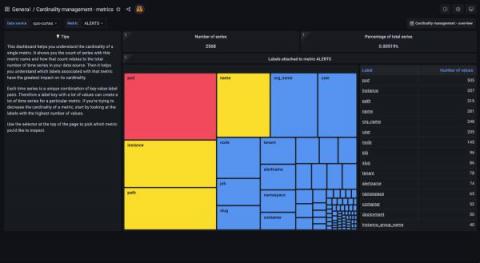
When there’s a cardinality explosion, it can cause problems: It’s a surprise, it’s noise, and it can increase your costs or cause performance degradation of your systems. Over the past year, we’ve improved our time series storage systems so that under normal use, high cardinality is no longer an issue. But as the operator of an observability platform, you should have tools you need to help protect that infrastructure.
SDKs naturally increase in size over time. After all, it does take more bytes to implement more features. This is not a big deal for most languages—the relative size of each new feature is small, and load times and storage aren’t big concerns for code running on a server.
Are you familiar with the four golden signals of Site Reliability Engineering (SRE): latency, traffic, errors, and saturation? Whether you’re a developer or an operator, you’ve likely been responsible for collecting, storing, or analyzing the data associated with these concepts. Much of this data is captured in application and infrastructure logs, which provide a rich history of what is happening behind the scenes in your workloads.