Operations | Monitoring | ITSM | DevOps | Cloud

The latest News and Information on Monitoring for Websites, Applications, APIs, Infrastructure, and other technologies.

Using AI & ML for Application Performance (APM)

Today, IT and site reliability engineering (SRE) teams face pressure to remediate problems faster than ever, within environments that are larger than ever, while contending with architectures that are more complex than ever. In the face of these challenges, artificial intelligence has become a must-have feature for managing complex application performance or availability problems at scale.

Peering, edge computing, and community with Grant Kirkwood | Network AF Episode 16

Chief Technology Officer and Co-founder of Unitas Global, Grant Kirkwood, joins Network AF to discuss motivations for starting the company and where they're at currently. Avi and Grant talk about what it is like to be a service provider and a solution provider (MSP) in one, and how it plays into what Avi calls the APIfication of networks and IT strategy.

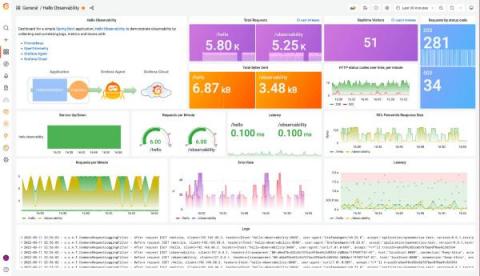
Set up and observe a Spring Boot application with Grafana Cloud, Prometheus, and OpenTelemetry

Spring Boot is a very popular microservice framework that significantly simplifies web application development by providing Java developers with a platform to get started with an auto-configurable, production-grade Spring application. In this blog, we will walk through detailed steps on how you can observe a Spring Boot application, by instrumenting it with Prometheus and OpenTelementry and by collecting and correlating logs, metrics, and traces from the application in Grafana Cloud.

The new Check Overview is now live!

Today, I'm excited to share the release of a long-planned and requested feature - our new Check Overview Page. Until now, Checkly enabled you to troubleshoot single alerts, but a deep dive into the long-term performance trends was limited. That is not the case anymore. In the new Check Overview, we’re introducing the enhanced analytics in four distinct categories: The update is focused on two important outcomes.

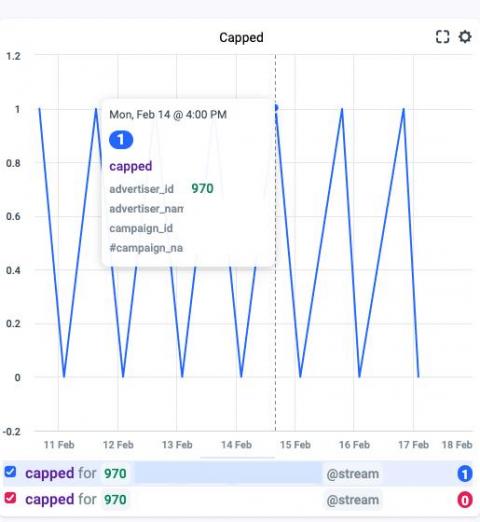
Reducing False Positives in Capped Campaigns

As the adtech industry continues to expand and the volume of ads sold and served grows exponentially, the only way to manage the business is through programmatic advertising. This approach utilizes data insights and algorithms to automatically serve ads to the right user, at the right time, on the right platform, and at the right price. The speed and scale of online advertising means that adtech companies need to collect, analyze, and act upon immense datasets instantaneously, 24 hours a day.

Observability for New Teams: Part 1

Any significant shift in an organization’s software engineering culture has the potential to feel tectonic, and observability (o11y for short)—or more specifically, Observability Driven Development—is no different. Leaning into observability, which calls for tool-enhanced investigation, hypothesis testing, and data richness can be cumbersome even for the most veteran of teams.

C-Suite Reporting with Log Management

When security analysts choose technology, they approach the process like a mechanic looking to purchase a car. They want to look under the hood and see how the product works. They need to evaluate the product as a technologist. On the other hand, the c-suite has different evaluation criteria. Senior leadership approaches the process like a consumer buying a car.

How To Configure Flowmon and WhatsUp Gold

In the previous “Flowmon and WhatsUp Gold: Discover application experience issues through single pane of glass” blog post we have demonstrated how IT Infrastructure Monitoring (WhatsUp Gold) and Network Performance Monitoring & Diagnostics (Flowmon) work seamlessly together to report on application performance, user experience and infrastructure status.

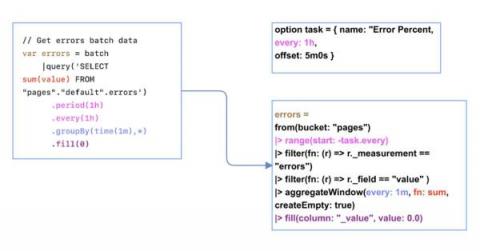
TL;DR InfluxDB Tech Tips: From TICKscripts to Flux Tasks

If you’re a 1.x user of InfluxDB, you might be a Kapacitor user as well. If so, you’re also familiar with TICKscripts, the data processing and transformation language for Kapacitor, the batch and stream processor for InfluxDB. Kapacitor is a great tool, but it’s largely a black box, so using and implementing TICKscripts to execute data processing tasks, checks, and notifications can be a challenging developer experience.