Operations | Monitoring | ITSM | DevOps | Cloud

The latest News and Information on Monitoring for Websites, Applications, APIs, Infrastructure, and other technologies.

Network Monitoring Safety Checklist-5 Steps to Take

Network monitoring is a vital part of your security architecture and layered security portfolio. Step one in your network monitoring safety checklist is making sure you have network monitoring in the first place. The rest of our steps assume you have network monitoring and lay out five ways to optimize its value.

Optimizing Microsoft Teams PSTN for the Hybrid Workforce

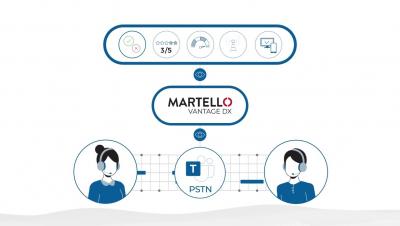
Martello Vantage DX™ enables IT teams to understand and share Microsoft Teams user experience metrics with every stakeholder involved in the service delivery. Gain insight into Microsoft Teams’ telephony user experience; whether the calls are direct or using PSTN connectivity such as Calling Plans, Direct Routing or Operator Connect.

Extend Device Lifecycles and Increase Employee Happiness

See how Nexthink’s IT department extended hardware refresh cycles while increasing employee happiness by offering device choices and incorporating sentiment and environment stewardship into the process. Like many organizations, our IT team has fallen behind on hardware refresh cycles due to the global chip shortage and ongoing supply chain issues.

AppScope 1.0: Changing the Game for Infosec, Part 2

We’re introducing AppScope 1.0 with a series of stories that demonstrate how AppScope changes the game for SREs and developers, as well as Infosec, DevSecOps, and ITOps practitioners. This blog is the second of two Infosec stories. For both Part 1 and Part 2, Randy Rinehart, Principal Product Security Engineer at Cribl, contributed extensively.

Elastic on Elastic: How we saved $100,000/month by keeping our own software up to date

Let's start with the bottom line: When we upgraded to Elasticsearch 7.15 last year, our internal observability clusters saw a reduction in inter-node traffic from 464TB to 204.5TB per day. We monitored this reduction through subsequent upgrades and noticed its impact on our data transfer and storage costs. So here it is: upgrading saved Elastic $3,500 per day, or approximately $100,000 a month, or $1.2 million annually.

Overview of Check Types

00:26 Web Checks

00:31 HTTP(S) Check

01:13 Transaction Check

01:45 API Check

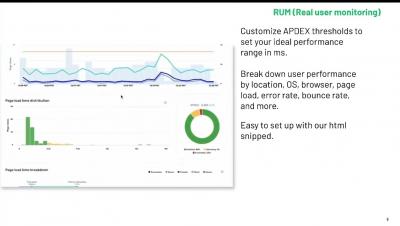
02:38 RUM Check

03:12 Malware and Virus Checks

03:37 SSL Check

04:00 Network Checks

04:04 WHOIS/Domain Expiry Check

04:19 DNS Check

04:43 Ping (ICMP) Check

04:59 NTP Check

05:22 SSH Check

05:34 TCP/UDP Port Checks

05:54 Email Checks

05:59 IMAP, POP, SMTP and Domain Blacklist Checks

06:37 Custom Checks

Logbook: Team Discussion and Full Incident History

We've launched a feature that will help you fix errors and performance issues as a team! 🎉 With Logbook you get the full incident history. Read and leave team comments, see which notifications were sent at what time, and see team activity for changes in incident states. It's now easier than ever to see what the current state of an incident is.

Real User Monitoring vs Synthetic Monitoring Comparison: What Should You Use? | Sematext

What is a real user monitoring tool? and what is a synthetic tool? Which monitoring tool do you really need? In this comparison video, we will look at the pros and cons of monitoring your site with synthetic vs. real user monitoring tools. Ultimately, we will see that these two technologies work together to ensure that your website runs well and is optimized for the end-user.

4 steps to bring network observability into your organization

The vast majority of corporate IT departments have a network monitoring solution. Typically that solution is built on standalone software platforms. If that’s you, this post is for you. You’re probably hearing a lot about “observability” these days. Generally, that’s the ability to answer any question and explore unknown or unexpected problems to deliver great digital experiences to your users.